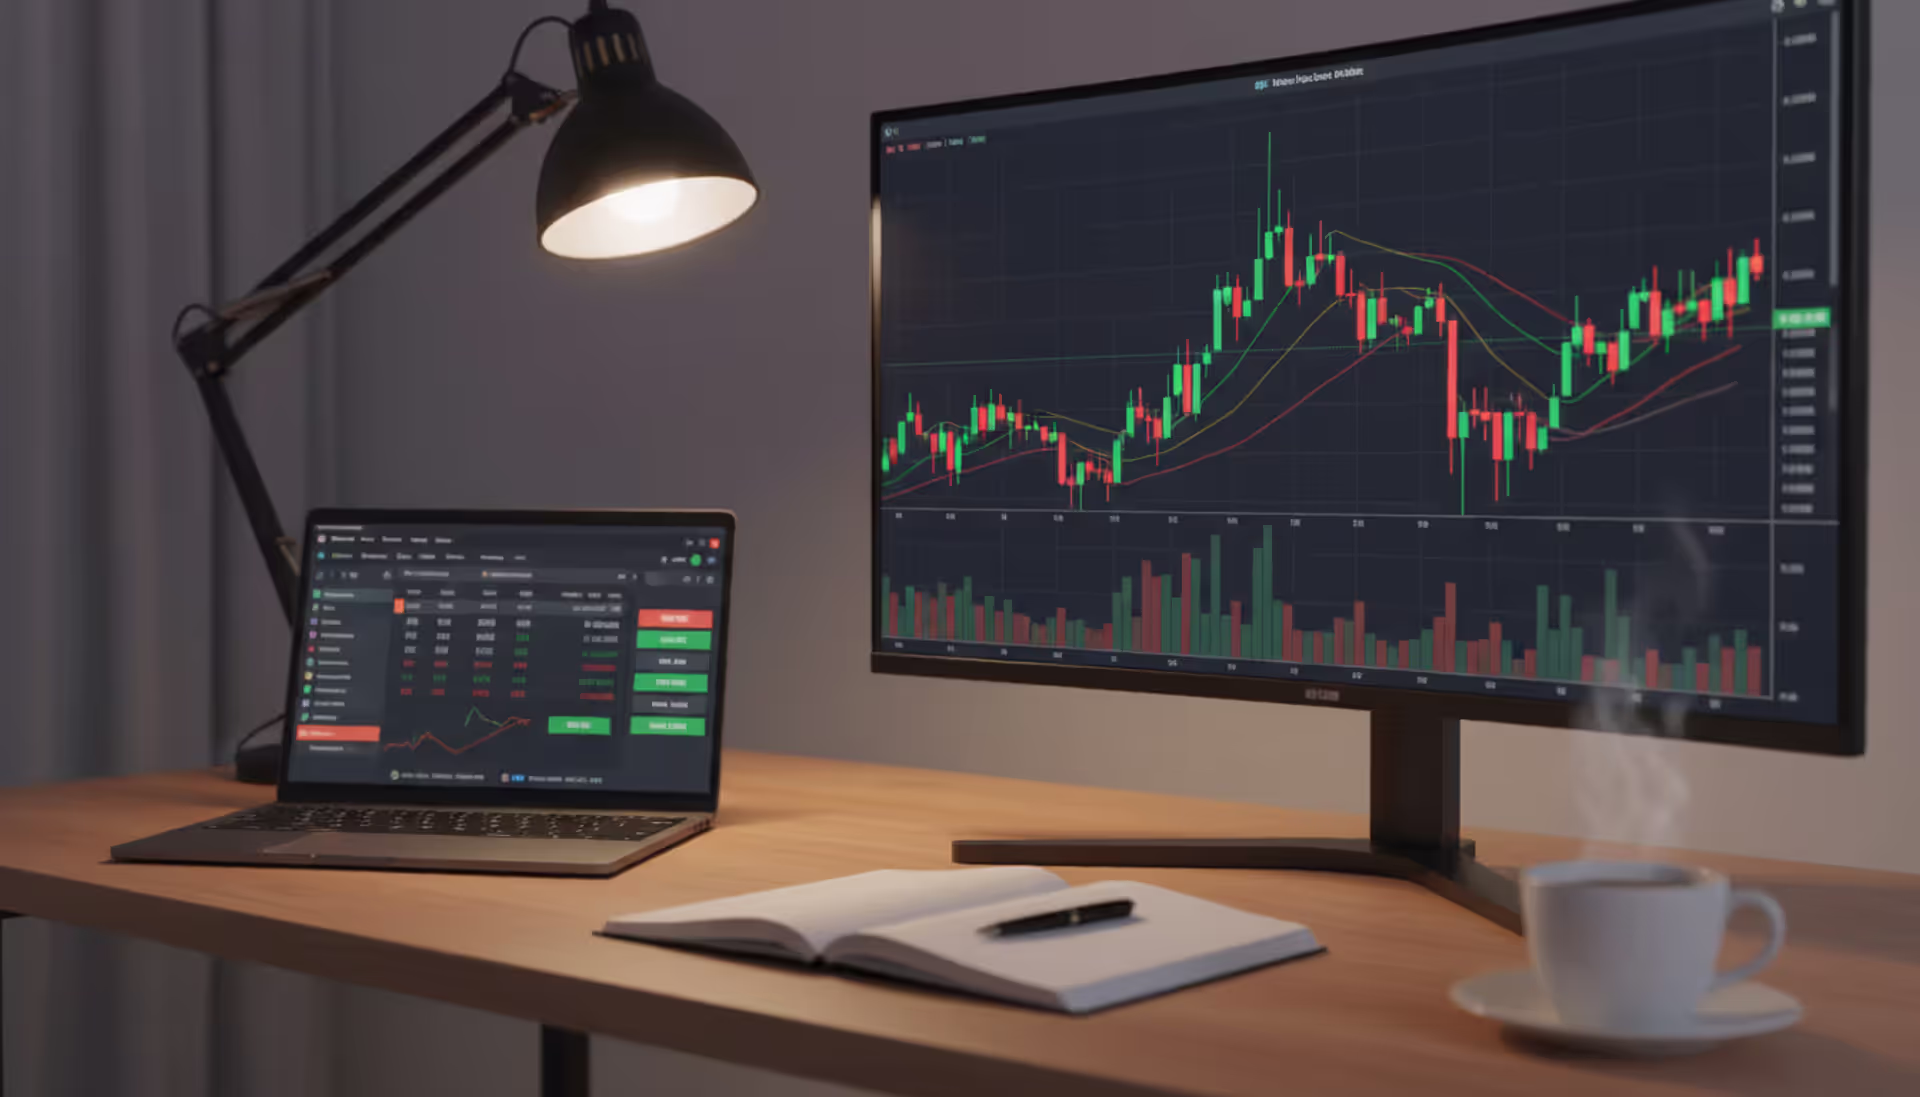
Trader workspace with a large monitor displaying a candlestick stock index chart, laptop with trading platform, coffee cup and notebook on desk, warm evening lamp lighting
Author: Marcus Ellington;Source: martinskikulis.com
You're staring at your screen. FTSE's up 30 points. Your £10-per-point position should be showing £300 profit, right? Except your account's down £15. What gives?
Here's the thing—most traders get wrecked in the translation between "I understand leverage" and "holy hell, where did my deposit go." You can read theory all day. But until you've seen why entering at 7,502 versus 7,500 matters, or watched a 50-pip currency move drain actual dollars from your balance, or woken up locked out because of a 2% overnight gap, you're flying blind.
Below, we're walking through five complete scenarios with actual numbers. Long equity positions. Short index trades. Forex calculations with real pip values. Margin requirements that'll trigger calls if you're not careful. Side-by-side costs versus CFDs. Every example includes genuine entry prices, the spreads you'll actually see on platforms, and the specific math determining whether you bank profits or eat losses.
No hand-waving. No "typically" or "around about." Just the numbers that matter.
What Is Spread Betting and How Does It Work?
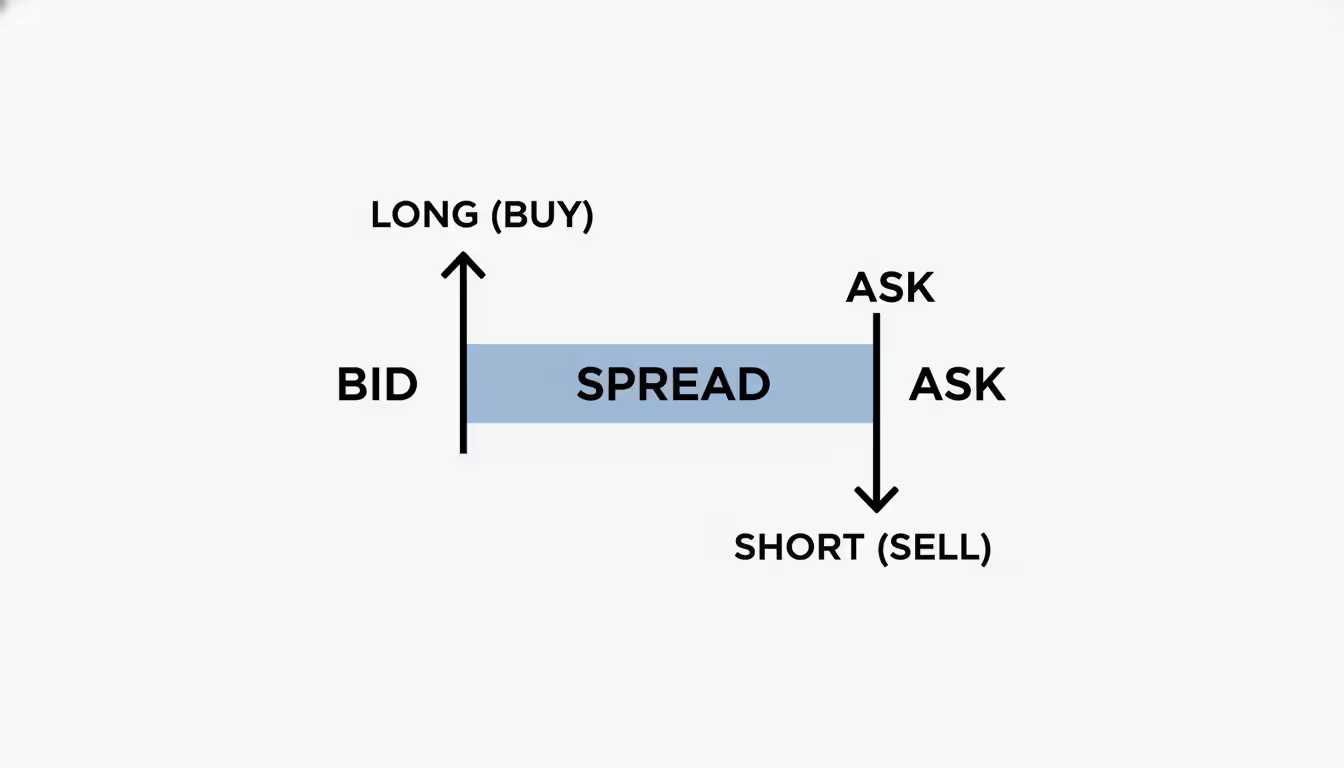
Here's the core concept: you wager a dollar amount on each point the market moves. Say you're bullish on the S&P. It's quoting 5,400 to sell, 5,402 to buy. You go long at £15 per point, accepting that 5,402 entry.
Market climbs to 5,450. You've captured 48 points. Your profit? 48 × £15 = £720 gross. That's before the spread cost and any overnight financing if you held past market close.
Now here's what most guides skip: you don't own anything. Not shares. Not futures contracts. Nothing. You've made a side bet with your broker. They're saying "we'll pay you £15 for every point this rises above 5,402, you pay us £15 for every point it drops below 5,402." That's literally the arrangement.
That bid-ask gap—two points between 5,400 and 5,402—represents your built-in disadvantage. You enter at 5,402. Change your mind one second later? You exit at 5,400. Already down two points (costing £30 with your £15 stake) before the market moves an inch.
Author: Marcus Ellington;
Source: martinskikulis.com
Leverage kicks in automatically. Your £15-per-point bet controls £81,030 worth of exposure. Most brokers want just 1–5% margin, so you might post £4,000 as collateral. Which means a 75-point drop against you wipes £1,125—nearly 30% of your account if you started with four grand. Gains accelerate identically fast when you're right.
Tax treatment? Total minefield depending where you live. UK residents pay zero capital gains on spread betting profits—it's classified as gambling. US regulators ban domestic brokers from offering it to retail clients entirely. Australians face capital gains obligations. Check your jurisdiction before assuming tax-free status.
Calculating Profit and Loss in a Spread Bet
The formula looks simple: (Exit price – Entry price) × Stake per point = Raw P&L. But watch how fast reality diverges once spreads, overnight costs, and slippage enter the picture.
Going Long: Bullish Position Example
Let's say you're expecting the FTSE 100 to rally this week. Your platform shows 7,500 / 7,502 (bid/ask). You go long at 7,502, wagering £5 per point.
Winning trade: Index surges. Two days later it's at 7,550 / 7,552. You close by selling at the current bid: 7,550.
Point movement: 7,550 – 7,502 = 48 points in your favor Raw calculation: 48 × £5 = £240
Hold on though—you held overnight twice. Your broker's charging 2.5% annual financing on the notional value (7,502 × £5 = £37,510 exposure). Works out to roughly £2.50 per night. So £5 total deduction.
Net profit: £240 – £5 = £235 after financing. Oh, and that entry spread? Two points × £5 = £10 gone immediately. Market needed to climb past 7,504 just to get you back to breakeven.
Losing trade: Index tanks instead. Three days later it's at 7,450 / 7,452. You bail at 7,450.
Financing costs hurt whether you're winning or losing—you're borrowing capital to control leveraged exposure. That spread? Vanishes the moment you click buy. Market owes you nothing until it moves past that handicap.
Going Short: Bearish Position Example
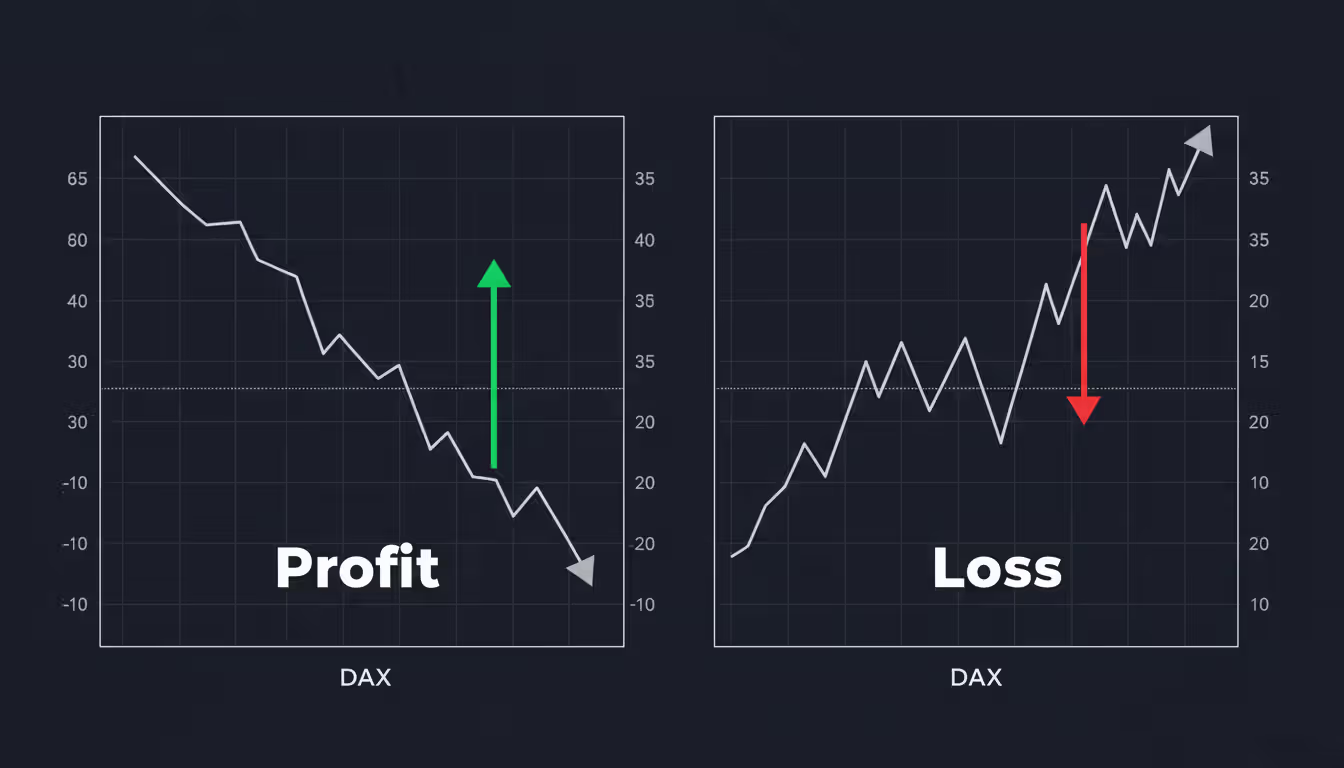
Germany's DAX looks stretched at 18,000 / 18,003. You think correction's coming. You sell (go short) at 18,000, betting €8 per point.
Market drops: DAX slides to 17,920 / 17,923 within hours. You close by buying back at 17,923 (the ask price).
No overnight financing since you closed same day. But that spread—three points × €8 = €24—already dinged you on entry. Market needed to drop to at least 17,997 before you saw green.
Market rallies: Instead, DAX rips higher to 18,080 / 18,083. You panic-cover at 18,083.
Short positions profit when prices fall, lose when they rise. And you're still paying that spread—entering at 18,000 (the bid) but needing to exit at the ask. Fighting uphill from the first tick.
Author: Marcus Ellington;
Source: martinskikulis.com
Spread Betting on Currency Pairs: A Detailed Example
Forex brings pip-based calculations and bigger notional amounts. Don't let the terminology mess with you—same core math underneath.
EUR/USD quotes 1.0850 / 1.0852. You're bullish on the euro, anticipating hawkish ECB commentary. You go long at 1.0852, staking $10 per pip.
One pip for this pair equals 0.0001. Move from 1.0852 to 1.0862 represents 100 pips. Your exposure approximates controlling a 100,000-unit forex position (what spot FX traders call a "standard lot"), though spread betting just defines it as $10 per 0.0001 increment.
Trade goes your way: Euro strengthens to 1.0920 / 1.0922 over three days. You close at the bid: 1.0920.
Your platform charged 0.8 pips spread—roughly $8 absorbed on entry. Add three nights of rollover. Swap rates depend on interest differentials; let's say you paid $4 nightly, total $12.
Net result: $680 – $12 overnight fees = $668 in your pocket.
Trade goes south: Euro crumbles on disappointing data. EUR/USD drops to 1.0800 / 1.0802. You cut losses at 1.0800.
If you held four nights—weekends count triple for some brokers—financing might drain another $16. Total loss: $520 + $16 = $536.
Margin requirements: Broker demands 3.33% collateral on majors (30:1 leverage). Notional exposure sits around $108,520 (1.0852 × 100,000 base units). Required margin: $108,520 × 3.33% ≈ $3,614. Keep a cushion above that. If your account dips near that figure because of floating losses, expect an automated margin call.
Currency markets can swing 50 pips during a single NFP release. That's $500 gained or vaporized in 90 seconds with a $10-per-pip bet. Volatility makes forex attractive. Also makes it lethal. You'll need tighter stops than you'd use on indices.
Understanding Margin and Stake Sizing
Margin isn't a fee. It's collateral your broker freezes while your bet stays open. Security deposit, basically. Two thresholds matter: initial margin (what you need upfront) and maintenance margin (the floor below which you get liquidated).
Real scenario: You want to bet on the S&P at 5,400, risking $20 per point. Broker requires 5% margin.
Your account holds $12,000. You post the $5,400, leaving $6,600 free. Market drops 150 points overnight. You've lost 150 × $20 = $3,000. Account balance shrinks to $9,000. $5,400 remains locked as collateral. You're still safe because $9,000 exceeds the maintenance level—typically 50–75% of initial margin, or $2,700–$4,050 in this case.
But suppose the S&P plunges another 100 points before you wake up. Another $2,000 gone. Balance: $7,000. Margin required: $5,400. Broker might issue a warning. Drop below $4,000 total equity? Automatic closure of your position. Usually at the worst possible moment.
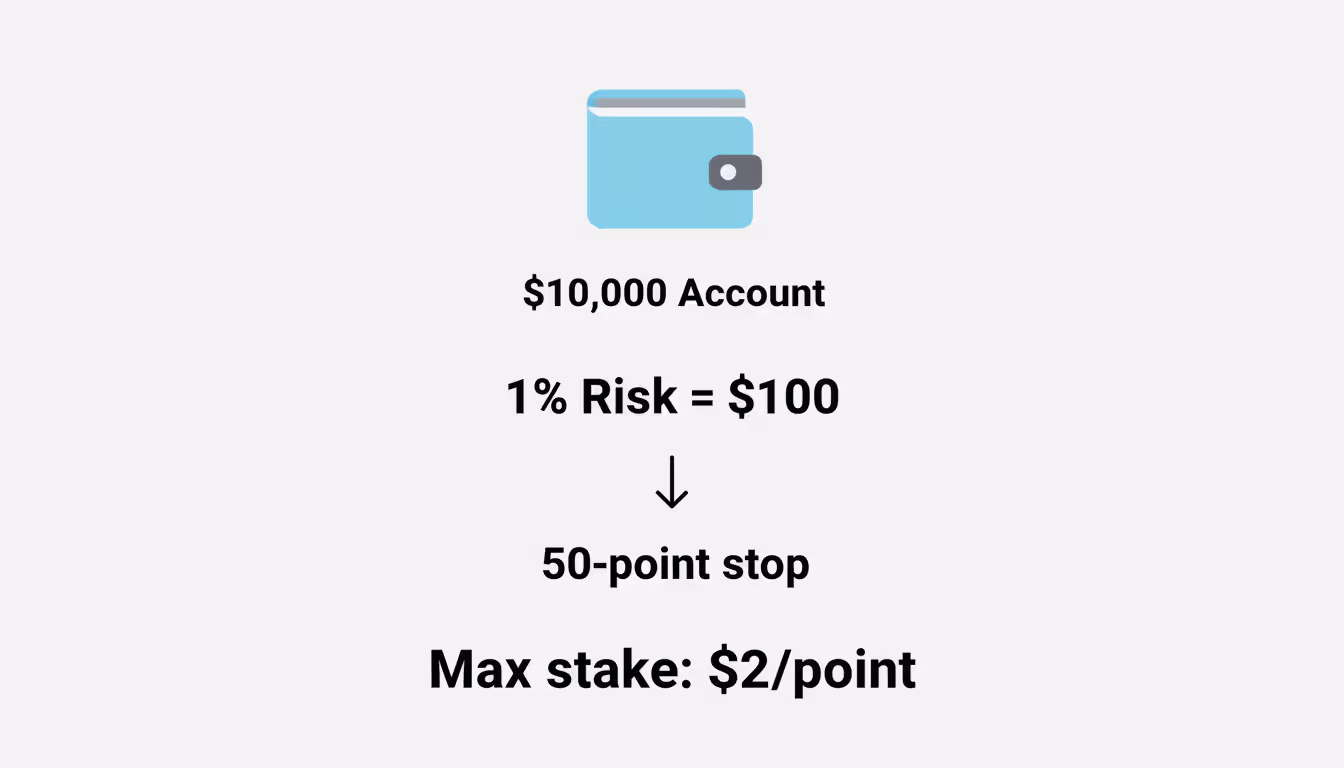
Position-sizing walkthrough: Most pros risk 1% of capital per trade. You've got $10,000 and you're willing to lose $100 on this bet. You identify a technical stop-loss 50 points away from entry.
$100 risk ÷ 50 points = $2 maximum stake per point.
Bet larger—say $5 per point—and that 50-point stop costs you $250. Violates your risk rule. Emotions tempt traders to size for desired profit ("I want to make $500, so I'll bet $10/point"). That's backward. Size for acceptable loss. Let the market determine your gain.
Author: Marcus Ellington;
Source: martinskikulis.com
I've seen traders blow entire accounts not from bad analysis but from wagering £50 per point on a £5,000 balance. One adverse 100-point swing = account gone. Leverage doesn't care about your conviction.
Risk Management Through Real Examples
Two traders. Both bullish on gold at 2,050 / 2,052. Watch what happens.
Trader A: Bets $2 per point. Places stop at 2,030 (22 points below entry). Maximum loss: 22 × $2 = $44 Account size: $5,000 → risking 0.88%
Trader B: Bets $20 per point. Same 2,030 stop. Maximum loss: 22 × $20 = $440 Account size: $5,000 → risking 8.8%
Gold reverses. Triggers both stops at 2,030. Trader A loses $44, shrugs, moves to the next setup with $4,956 intact. Trader B hemorrhages $440—nearly 9% of capital evaporated. Three consecutive losses like that? Account's crippled, psychologically and financially.
Worst-case scenario (no stop-loss): Trader B, convinced gold will bounce, skips the stop. Gold crashes to 1,950 during a Fed surprise. Broker finally steps in with a margin call.
Loss: (2,052 – 1,950) × $20 = $2,040
That's 40.8% of the $5,000 account annihilated. Some brokers offer negative-balance protection—caps losses at your deposit. But not all. Even with protection, losing half your stake in one position leaves you financially and emotionally gutted.
Three habits that prevent disasters:
Hard stops on every position. No exceptions. No "just this once." Set them before entry, not after the market moves against you.
Guaranteed stops for overnight holds. Costs a small premium—maybe 0.3% of position size—but prevents gap-through disasters during earnings or geopolitical shocks.
Dynamic sizing. Account grows to $15,000? Recalculate position limits upward. Drops to $8,000? Scale down proportionally. Fixed $10/point stakes make no sense when equity fluctuates.
The common thread among successful traders isn't a secret indicator or strategy—it's ferocious discipline around position sizing and loss limits. The best trade setup in the world becomes toxic when sized recklessly
— Jack Schwager
Spread Betting vs CFDs: Side-by-Side Comparison
Both let you speculate on price swings with leverage. Neither gives you ownership of underlying assets. But subtle differences in tax treatment, cost structure, and availability can tip the scale depending where you live and how you trade.
Element
Spread Betting
CFDs
Tax handling
Profits exempt from capital gains tax in UK (classified as wagering); unavailable to US clients
Gains subject to capital gains tax in most regions; available globally with restrictions
Ownership rights
Pure price speculation; zero claim to dividends or voting
Derivative contract mirroring asset; may receive dividend adjustments
Fee model
Spread markup plus overnight financing
Commission per trade or spread markup, plus overnight financing
Expiry structure
Daily-funded (rolls indefinitely) or futures-style quarterly contracts
Typically perpetual rolling contracts; some futures-based CFDs available
Leverage limits
Often 20:1 to 100:1 depending on asset class
Usually 20:1 to 50:1 (stricter under ESMA rules in EU)
Regulatory access
Banned for US retail; common in UK, Australia, Singapore
Permitted in US with constraints; widely available elsewhere
When spread betting wins: You're a UK taxpayer making consistent profits. No capital gains liability saves you 10–20% right off the top. You prefer the simplicity of "£5 per point" language versus calculating lot sizes. You trade indices or commodities where spreads are tight.
When CFDs make more sense: You live somewhere spread betting isn't offered. (US resident stuck with futures/options.) You trade high volumes—commission-based CFD pricing can beat spread markups on large positions. You run algorithmic systems that integrate better with CFD APIs and institutional platforms.
Risk-wise? They're twins. Both magnify gains and losses identically. Both can drain your account overnight if you mismanage leverage. Your decision hinges on tax efficiency and platform availability, not risk appetite.
Author: Marcus Ellington;
Source: martinskikulis.com
Frequently Asked Questions About Spread Betting Examples
How do you calculate profit on a spread bet?
Take your exit level minus your entry level. Multiply the difference by your per-point stake. Going long at 5,000, closing at 5,050, betting $5/point: that's (5,050 – 5,000) × $5 = $250 raw profit. Then subtract spread costs and any overnight financing to get your net figure.
What happens if my spread bet goes against me?
Your account balance drops by (adverse point movement × stake size). If losses push your equity below the broker's maintenance margin threshold, you'll get a margin call demanding more funds. Ignore it? Broker force-closes your position—usually locking in the worst possible price. Always use stop-losses to prevent this nightmare.
How much margin do I need to open a spread bet?
Varies by asset and broker. Anywhere from 0.5% (major forex pairs with high leverage) to 20% (volatile individual stocks). A £100,000 exposure at 5% margin needs £5,000 collateral. Check your broker's margin schedule before placing any bet. Keep extra cushion above minimums to survive normal market swings.
Can you lose more than your stake in spread betting?
Absolutely. Your "stake" is the per-point amount, not a loss cap. Betting $10/point with a 200-point adverse move costs you $2,000—regardless of how much margin you deposited. Many brokers provide negative-balance protection, capping total loss at your account balance. But coverage isn't universal. Never rely on it. Manage risk yourself with stops.
What's the difference between spread betting and CFD trading?
Spread betting quotes positions in stake-per-point terms and may offer tax exemptions (UK gambling classification). CFDs use standardized contract units and are available globally, including the US with limitations. Both deliver identical leverage and risk. Your choice depends on tax residency and regulatory access, not fundamental differences in mechanics.
How do you size your stake in a spread bet?
Decide how much capital you'll risk—commonly 1–2% of account balance. Measure your stop-loss distance in points. Divide risk by stop distance: if you'll risk $100 and your stop sits 25 points away, bet no more than $100 ÷ 25 = $4 per point. This caps downside at your predefined threshold no matter where you place the stop.
Spread betting offers a tax-efficient, straightforward route into leveraged speculation—assuming you understand the numbers before clicking buy or sell. The gap between grasping theory and executing real positions has cost countless beginners their deposits.
You've now seen exactly how a 50-point FTSE move converts to pounds in your account. How forex pip calculations scale with stake size. Why a 3% margin requirement doesn't mean you can only lose 3%.
Successful traders calculate margin needs before entry. Set protective stops based on account size, not wishful thinking. Resize positions as equity grows or shrinks. They know leverage accelerates both directions equally—a 100-point index swing can double your week's gains or erase them in an afternoon.
Before risking real money? Open a demo account. Run through these scenarios yourself. Enter at actual quoted prices. Track spread costs. Simulate overnight holds. Verify your P&L matches the formulas. Markets move fast. Leverage multiplies every tick.
Master the arithmetic, respect the risks, and you'll navigate spread betting with the precision it demands rather than the overconfidence it punishes.
Swap rates represent the interest cost or credit applied when forex traders hold positions past the daily rollover time. Understanding how these overnight fees work, when you pay or earn them, and their cumulative impact is essential for swing traders and anyone implementing carry trade strategies in 2026
An overnight index swap is a derivative where parties exchange fixed and floating interest payments based on compounded overnight rates. These instruments have become the standard for derivatives discounting and provide key insights into central bank policy expectations and market stress levels
Interest rate movements can transform profitable loans into financial burdens overnight. Companies with floating-rate debt and bond investors face the same challenge: protecting against adverse rate shifts without sacrificing upside. This guide explains hedging instruments, duration strategies, and how to match protection to your specific exposure
Interest rate arbitrage exploits interest differentials between countries to generate profit. This comprehensive guide explains covered and uncovered strategies, carry trades, why covered arbitrage is considered risk-free, and the real-world constraints that limit arbitrage opportunities in modern currency markets
The content on this website is provided for general informational and educational purposes only. It is intended to explain concepts related to Forex (FX) trading, currency markets, leverage, hedging, and risk management.
All information on this website, including articles, guides, and examples, is presented for general educational purposes. Forex trading carries significant risk, and outcomes may vary depending on market conditions, leverage, and individual decisions.
This website does not provide financial, investment, or trading advice, and the information presented should not be used as a substitute for consultation with qualified financial professionals.
The website and its authors are not responsible for any errors or omissions, or for any outcomes resulting from decisions made based on the information provided on this website.