When a corporation or government borrows money, lenders want assurance they'll be repaid. Credit default swaps emerged as a financial tool to transfer the risk of borrower default from one party to another. The price of this insurance—expressed as a CDS spread—has become one of the most closely watched indicators of credit health in global markets.
A CDS spread represents the annual cost, in basis points, that a buyer pays to protect against default on a specific debt obligation. If a company's five-year CDS spread trades at 250 basis points, the protection buyer pays $250,000 annually to insure $10 million of that company's debt. This pricing mechanism creates a real-time barometer of default risk that often moves faster than traditional credit ratings.
Understanding Credit Default Swaps
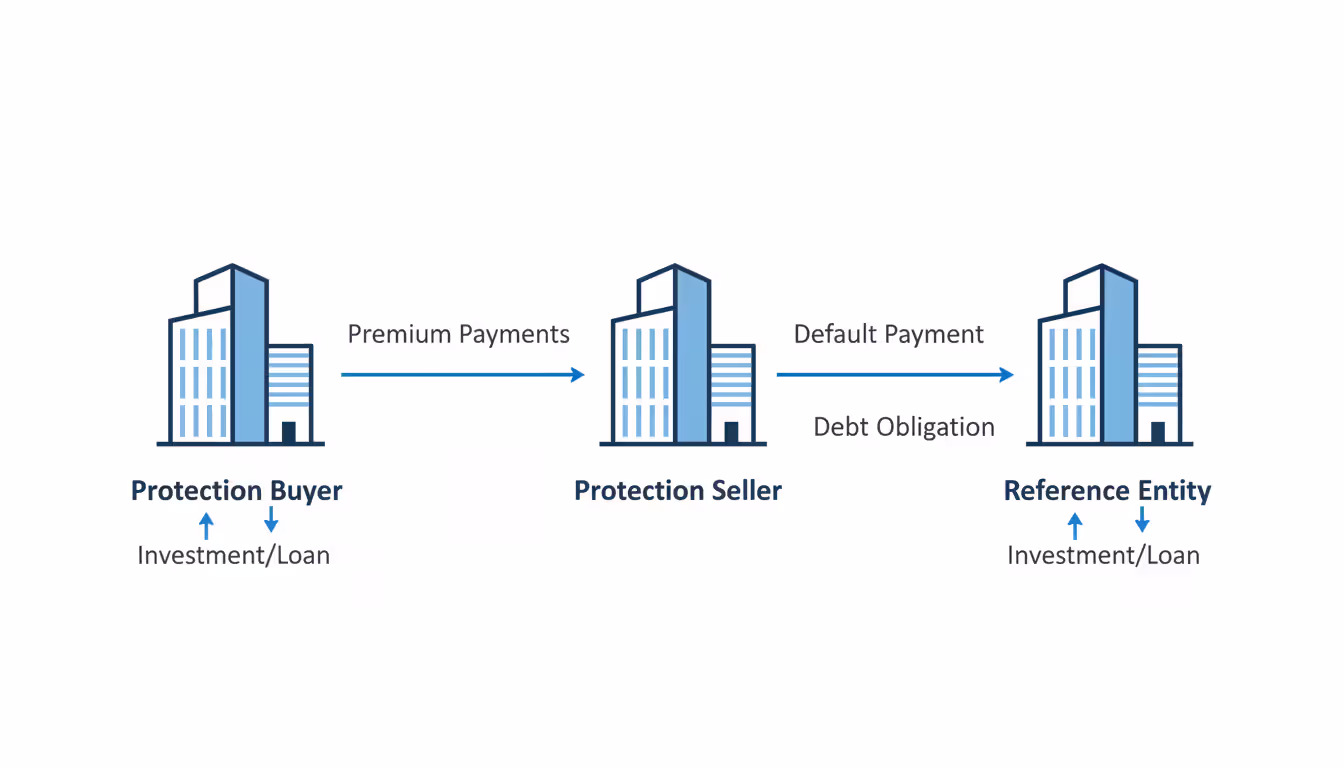
Credit default swaps function like insurance policies on debt. The protection buyer makes regular premium payments to the protection seller. If the reference entity defaults—fails to make scheduled payments or undergoes restructuring—the seller compensates the buyer for losses. Unlike actual insurance, however, you don't need to own the underlying bonds to buy CDS protection. This characteristic makes them both hedging tools and speculative instruments.
Think of a CDS contract like homeowner's insurance with a twist: your neighbor can also buy insurance on your house. Banks and asset managers purchase CDS protection to hedge bond portfolios they actually own. Hedge funds might buy protection without owning the bonds, betting that a company's creditworthiness will deteriorate. On the selling side, institutions collect premium income, wagering that defaults won't occur or will be manageable.
The reference entity—the borrower whose debt is being insured—doesn't participate in these transactions. A company can have billions in CDS contracts outstanding without knowing exactly who holds them. This opacity contributed to systemic concerns during the 2008 financial crisis, when counterparty risk in the CDS market threatened the broader financial system.
CDS contracts typically run for five years, though one-year, three-year, and ten-year maturities trade actively. Settlement occurs through physical delivery (the buyer delivers defaulted bonds and receives par value) or cash settlement (the difference between par and recovery value changes hands). Most modern contracts use cash settlement with standardized auction processes to determine recovery rates.
Author: Marcus Ellington;
Source: martinskikulis.com
These instruments serve as market indicators because their pricing reflects collective wisdom about default probability. Unlike credit ratings, which change infrequently and sometimes lag market developments, CDS spreads adjust continuously as new information emerges. When a company announces disappointing earnings or a country faces political turmoil, spreads widen immediately—often before rating agencies act.
How CDS Spreads Reflect Credit Risk
The width of a CDS spread directly correlates with the market's assessment of default probability. A borrower with a 50-basis-point spread is perceived as far less risky than one trading at 500 basis points. This relationship isn't perfectly linear—spreads incorporate expected loss (probability of default multiplied by loss given default), liquidity premiums, and counterparty considerations—but the core principle holds: wider spreads mean higher perceived risk.
Mathematical models attempt to extract implied default probabilities from spread levels. A simplified calculation might suggest that a 200-basis-point spread on a five-year contract implies roughly a 3-4% cumulative default probability over that period, assuming a 40% recovery rate. Professional risk managers use more sophisticated models that account for term structure, recovery assumptions, and correlation effects, but the directional relationship remains intuitive.
Spread movements tell stories about changing fortunes. When an automotive manufacturer faces declining sales and rising debt levels, its CDS spreads widen as protection becomes more expensive. Conversely, a technology company that improves margins and reduces leverage sees spreads tighten. These movements often precede changes in bond prices and credit ratings, making CDS spreads a leading indicator of credit deterioration or improvement.
Market participants monitor spread direction and velocity. A gradual 20-basis-point widening over three months might reflect sector-wide pressure. A sudden 100-basis-point spike in two days signals acute concern—perhaps a missed earnings target, regulatory investigation, or liquidity crisis. The speed of movement matters as much as the absolute level.
The credit default swap market has become the most important barometer of credit risk in the financial system
— Alan Greenspan
What Widening CDS Spreads Mean for Investors
Widening spreads send clear warning signals. For bondholders, wider spreads typically coincide with declining bond prices, as the two move inversely. If you hold corporate bonds and watch the issuer's CDS spreads balloon from 150 to 400 basis points, your bonds are likely trading well below par. This presents a dilemma: sell at a loss or hold and hope for recovery.
Equity investors should also pay attention. Deteriorating credit quality often precedes stock price declines, though the relationship isn't mechanical. A company with widening spreads may be overleveraged, facing operational challenges, or experiencing industry headwinds—all factors that eventually pressure share prices. Some quantitative hedge funds incorporate CDS spread changes into equity trading models, treating spread widening as a sell signal.
Widening spreads create opportunities for sophisticated traders. If you believe the market overreacts to temporary bad news, you might sell CDS protection at elevated spreads, collecting higher premiums while betting on stabilization. This strategy carries substantial risk—you're essentially taking the other side of the market's concern—but can be profitable when spreads normalize.
The absolute level matters more than the direction in some contexts. A spread widening from 30 to 60 basis points represents a doubling of perceived risk, even though the absolute increase is small. Meanwhile, a spread narrowing from 800 to 700 basis points still indicates a distressed credit, despite the improvement. Context distinguishes meaningful signals from noise.
CDS Spreads vs Bond Yields as Risk Indicators
Both CDS spreads and bond yield spreads measure credit risk, but they do so through different mechanisms and each offers distinct advantages.
Indicator Type
What It Measures
Data Source
Advantages
Limitations
CDS Spread
Cost of default protection in basis points
OTC derivatives market
Real-time pricing; isolates credit risk; no need to own bonds; standardized contracts
Less transparent; counterparty risk; limited retail access; can be illiquid for smaller names
Bond Yield Spread
Excess yield over risk-free rate
Bond market transactions
Reflects actual borrowing costs; broad market participation; transparent pricing; long historical data
Mixes credit risk with liquidity, duration, and technical factors; less responsive to rapid changes; fragmented across multiple issues
Bond yield spreads—the difference between a corporate bond's yield and a comparable Treasury security—incorporate credit risk alongside other factors. A corporate bond might trade at 200 basis points over Treasuries, but that spread includes compensation for lower liquidity, embedded options (like call provisions), and supply-demand imbalances in specific maturities. CDS spreads, by contrast, focus more purely on default risk.
The two indicators usually move together but can diverge. During liquidity crises, bond spreads may widen more than CDS spreads as investors demand extra compensation for illiquidity. In normal markets, arbitrageurs keep the two reasonably aligned through "basis trades"—simultaneously buying bonds and CDS protection (or selling bonds and CDS protection) to exploit mispricings.
CDS spreads often lead bond spreads during credit events. When negative news breaks, CDS markets—populated by active traders—react immediately. Bond markets, where many investors buy and hold, may take longer to reflect new information. This lag makes CDS spreads valuable early warning indicators for bond portfolio managers.
Basis—the difference between CDS spreads and bond spreads—itself provides information. A positive basis (bond spread exceeds CDS spread) suggests bonds are cheap relative to CDS, potentially due to forced selling or liquidity concerns. A negative basis indicates the opposite and might reflect technical factors in the CDS market.
Sovereign CDS Spreads and Country Risk Assessment
Governments issue debt in their own currencies and, in theory, can always print money to repay obligations. Yet sovereign defaults occur with troubling regularity, making sovereign CDS an important tool for assessing country risk.
Sovereign spreads reflect multiple risk dimensions: fiscal sustainability, political stability, economic growth prospects, external debt burdens, and willingness to honor obligations. A country with manageable debt but a history of strategic defaults might trade at wider spreads than a more indebted nation with a strong repayment culture.
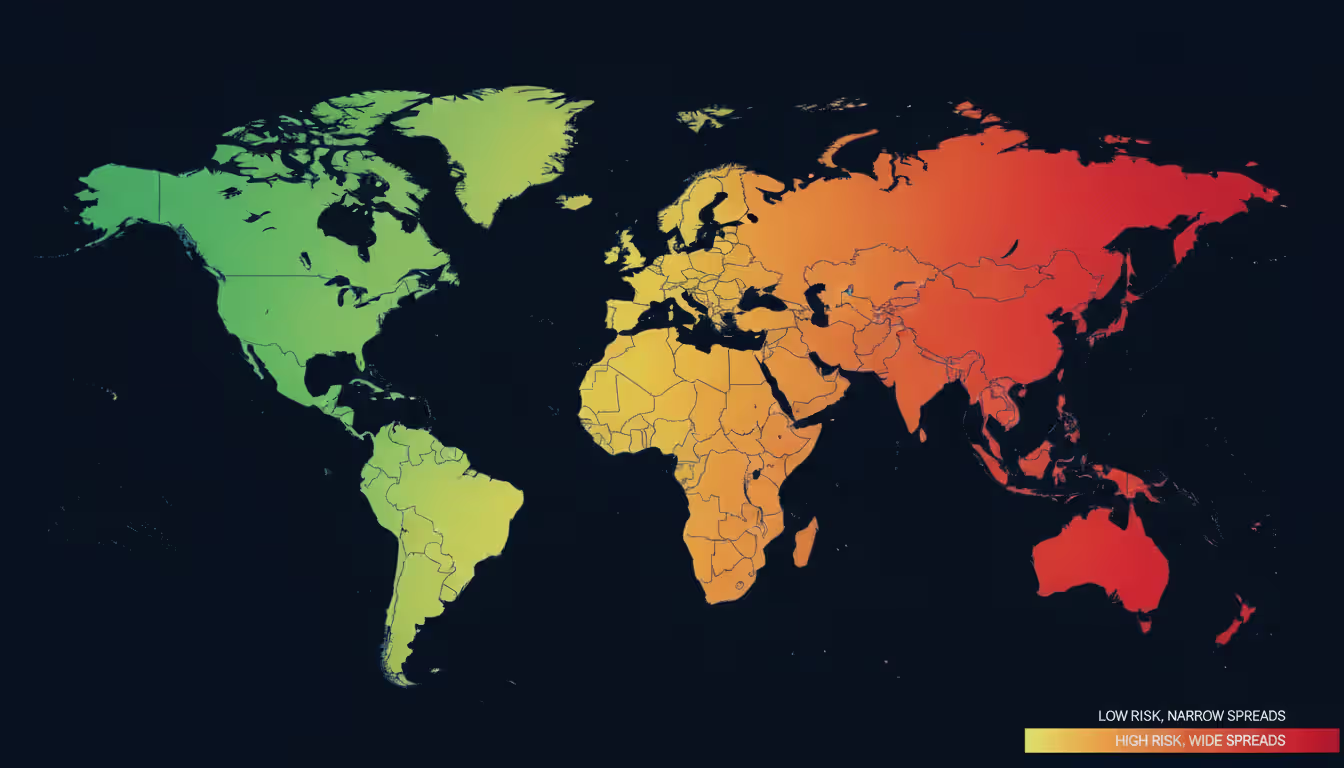
Consider the range of sovereign spreads across different regions. As of early 2026, German CDS spreads trade around 10-15 basis points, reflecting the country's fiscal discipline and economic strength. Italian spreads hover near 120-150 basis points, elevated by high debt-to-GDP ratios and periodic political uncertainty. Emerging market spreads vary dramatically: Chile might trade at 60 basis points, while Argentina's spreads exceed 2,000 basis points due to serial defaults and economic instability.
These spreads influence borrowing costs and capital flows. A country experiencing spread widening faces higher interest rates on new debt issuance, straining public finances. Foreign investors demand higher returns to hold that country's bonds, potentially triggering capital outflows. This dynamic can become self-reinforcing: widening spreads increase fiscal pressure, which further widens spreads.
Political events drive sovereign spread volatility. Elections that might bring fiscally irresponsible governments to power typically widen spreads. Constitutional crises, corruption scandals, or geopolitical conflicts have similar effects. Conversely, successful fiscal reforms, IMF agreements, or political stabilization narrow spreads.
The European sovereign debt crisis of the early 2010s demonstrated how sovereign CDS spreads can signal systemic risk. Greek spreads exploded from around 100 basis points in early 2009 to over 10,000 basis points by 2012 as default became inevitable. Contagion spread to Portugal, Ireland, Spain, and Italy, with their spreads widening in sympathy. Policymakers and investors watched these spreads obsessively as real-time indicators of crisis severity.
Sovereign CDS markets also reveal country risk hierarchies. Emerging markets trade at consistently wider spreads than developed markets, reflecting higher default probabilities. Within emerging markets, spreads differentiate between relatively stable economies and those with chronic problems. These distinctions guide international investment decisions and risk management strategies.
Author: Marcus Ellington;
Source: martinskikulis.com
CDS Spreads and Currency Correlation
A country's credit quality and currency value often move together, creating observable correlations between sovereign CDS spreads and exchange rates. This relationship stems from shared underlying fundamentals and feedback loops between credit and currency markets.
When a country's sovereign spreads widen, its currency typically weakens. The mechanism is straightforward: higher spreads signal increased default risk and economic problems, reducing investor appetite for that country's assets. Capital flows out, selling pressure on the currency intensifies, and the exchange rate depreciates. This pattern played out repeatedly during the European debt crisis, when peripheral European countries saw both spread widening and currency pressure (though the shared euro complicated the dynamic).
The correlation works in reverse as well. Currency depreciation can widen CDS spreads, particularly for countries with substantial foreign-currency debt. A weaker currency makes dollar- or euro-denominated obligations more expensive to service in local currency terms, increasing default risk. This creates a dangerous spiral: currency weakness widens spreads, which triggers more capital outflows, which further weakens the currency.
Emerging markets exhibit particularly strong CDS-currency correlations. Take Turkey as an example: during periods of lira weakness in recent years, Turkish sovereign spreads widened significantly. Investors viewed currency depreciation as evidence of economic mismanagement and increased default risk. The correlation coefficient between Turkish CDS spreads and USD/TRY exchange rates often exceeds 0.7, indicating a strong positive relationship.
Not all countries show the same correlation strength. Commodity exporters may see their currencies move with commodity prices while spreads respond to fiscal policy. Countries with capital controls experience weaker correlations because currency movements don't fully reflect market sentiment. Advanced economies with deep financial markets and independent central banks often show more modest correlations than emerging markets.
Currency hedging decisions depend partly on CDS spread levels. A multinational corporation holding receivables in a country with widening sovereign spreads faces both currency risk and potential payment disruption. Rising spreads might prompt more aggressive currency hedging or even reconsideration of business exposure. Portfolio managers similarly adjust currency positions based on sovereign credit trends reflected in CDS markets.
Who Participates in the CDS Market
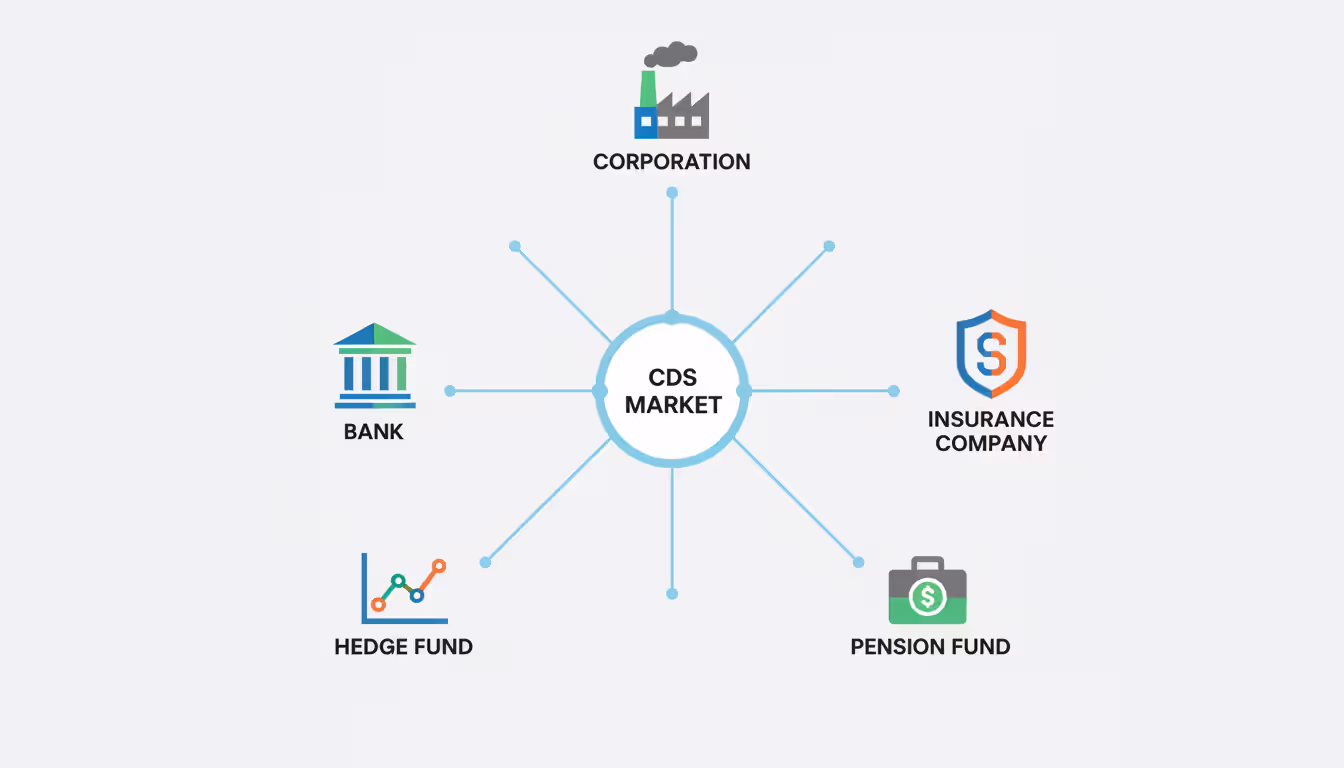
The CDS market brings together diverse participants with varying motivations, creating a complex ecosystem of buyers and sellers.
Banks serve multiple roles. As dealers, they provide liquidity by quoting prices and facilitating trades between clients. As hedgers, they buy protection on loans they've originated, transferring credit risk off their balance sheets. Regulatory capital requirements make CDS hedging attractive—protection purchased against a loan reduces the capital banks must hold against that exposure. Major institutions like JPMorgan, Goldman Sachs, and Deutsche Bank dominate dealer activity.
Hedge funds approach CDS as trading instruments. Some funds specialize in credit arbitrage, exploiting pricing discrepancies between CDS and bonds or across different parts of a company's capital structure. Others take directional views, buying protection before anticipated credit deterioration or selling protection to collect premiums on stable credits. Event-driven funds use CDS to express views on mergers, restructurings, or bankruptcies.
Insurance companies and pension funds traditionally sell CDS protection to generate income. These institutions have long investment horizons and can tolerate the risk of occasional defaults in exchange for steady premium income. However, the 2008 crisis—particularly AIG's near-collapse from CDS exposure—made these institutions more cautious about tail risks.
Author: Marcus Ellington;
Source: martinskikulis.com
Asset managers running bond portfolios use CDS for hedging and tactical positioning. Rather than selling bonds and incurring transaction costs, a manager concerned about a specific issuer can buy CDS protection, maintaining bond exposure while hedging default risk. This flexibility makes CDS valuable portfolio management tools.
Corporations occasionally participate to hedge their own supply chain risks. An automotive manufacturer dependent on a key supplier might buy CDS protection on that supplier, creating a financial offset if the supplier defaults and disrupts production. This application remains relatively niche but illustrates the market's versatility.
Sovereign wealth funds and central banks participate less directly but monitor CDS markets closely. These institutions manage enormous pools of capital and need comprehensive risk assessment tools. CDS spreads inform their decisions about which countries' bonds to hold and how to diversify portfolios.
Market concentration presents ongoing concerns. The CDS market, while large in notional terms, involves a relatively small number of active dealers. This concentration creates counterparty risk—if a major dealer fails, the ripple effects could be substantial. Post-crisis reforms mandated central clearing for standardized CDS contracts, reducing but not eliminating this risk.
Common Questions About CDS Spreads
What is a CDS spread in simple terms?
A CDS spread is the annual cost, expressed in basis points, to insure against default on a specific debt obligation. One basis point equals 0.01%, so a 200-basis-point spread means paying $200,000 per year to protect $10 million of debt. Higher spreads indicate the market perceives greater default risk. The spread represents the premium a protection buyer pays to a protection seller, similar to an insurance premium but traded in financial markets.
How do you read a CDS spread quote?
CDS spreads are quoted in basis points per year. A quote of "350" means 350 basis points or 3.5% annually. For a $10 million notional amount, the annual payment would be $350,000, typically paid quarterly ($87,500 per quarter). Quotes include the maturity—"5-year CDS at 350" refers to a five-year contract. Dealers quote bid-ask spreads; the bid is where they'll buy protection (lower spread) and the ask is where they'll sell protection (higher spread). A typical quote might be "345-355," with the 10-basis-point difference representing the dealer's profit margin.
Are high CDS spreads always a bad sign?
High spreads usually indicate elevated default risk, but context matters. A spread of 400 basis points is concerning for an investment-grade corporation but might be normal for a speculative-grade company in a cyclical industry. Some businesses operate successfully with higher spreads due to leverage-intensive business models or industry characteristics. Additionally, spreads can temporarily spike due to technical factors—low liquidity, hedging flows, or market-wide stress—rather than fundamental deterioration. Experienced investors look at spread trends, peer comparisons, and underlying business fundamentals rather than absolute levels in isolation.
Can individual investors trade CDS contracts?
Direct CDS trading remains largely inaccessible to retail investors. The market operates over-the-counter with high minimum transaction sizes, typically $5-10 million notional amounts. Participants need ISDA (International Swaps and Derivatives Association) agreements with counterparties, which individual investors rarely obtain. However, retail investors can gain indirect exposure through credit-focused exchange-traded funds, closed-end funds that use CDS for hedging, or structured products linked to CDS indices. Some sophisticated investors access CDS through managed accounts at prime brokers, but this requires substantial capital and experience.
How often do CDS spreads change?
CDS spreads fluctuate continuously during trading hours as market participants adjust their views of credit risk. For actively traded names—large corporations and major sovereigns—spreads might change dozens of times per day in response to news, broader market movements, or trading flows. Less liquid credits may see infrequent price updates, sometimes only when a dealer receives a specific inquiry. Spreads typically move more during earnings announcements, credit rating actions, economic data releases, or company-specific news events. During market stress, spreads can gap significantly between one trading session and the next.
What's the difference between a CDS spread and a credit rating?
Credit ratings are opinions issued by rating agencies (Moody's, S&P, Fitch) about default probability, expressed as letter grades (AAA, BBB, etc.). They change infrequently, perhaps once or twice a year for a typical issuer, and reflect committee decisions based on detailed analysis. CDS spreads are market-determined prices that change continuously, reflecting collective investor sentiment and real capital at risk. Spreads typically react faster than ratings to changing conditions—a company's spreads might widen weeks or months before a rating downgrade. Ratings look through short-term volatility and aim for stability, while spreads respond immediately to new information. Both measure credit risk but through fundamentally different mechanisms.
CDS spreads have evolved from obscure derivatives pricing to essential indicators of credit health across global markets. They provide real-time, market-based assessments of default risk for corporations and governments, often signaling problems before traditional metrics respond. The relationship between spreads and underlying credit quality—while not perfectly linear—offers valuable insights for investors, risk managers, and policymakers.
Understanding how spreads reflect credit risk, their correlation with other market variables, and their interpretation requires moving beyond simple rules of thumb. A 300-basis-point spread means something different for a utility company versus a biotech startup, for Germany versus Greece. Context, comparison to peers, and trend analysis matter more than absolute levels.
The market's complexity—involving specialized participants, over-the-counter trading, and technical factors—can obscure the fundamental signal. Yet the core concept remains accessible: wider spreads mean higher perceived risk, narrower spreads suggest improving credit quality. Whether you're managing a bond portfolio, evaluating equity investments, or assessing macroeconomic risks, CDS spreads provide a valuable lens for viewing credit conditions.
As financial markets continue evolving, CDS spreads will likely remain central to credit analysis. Their ability to aggregate diverse information sources into a single price, update continuously, and separate credit risk from other factors makes them irreplaceable tools for navigating an increasingly interconnected global financial system.
Swap rates represent the interest cost or credit applied when forex traders hold positions past the daily rollover time. Understanding how these overnight fees work, when you pay or earn them, and their cumulative impact is essential for swing traders and anyone implementing carry trade strategies in 2026
Spread betting lets you speculate on market moves without owning the asset. This guide walks through real examples—long and short positions, forex pairs, margin calculations—showing exactly how profits and losses accumulate, how to size stakes responsibly, and what happens when trades go wrong
An overnight index swap is a derivative where parties exchange fixed and floating interest payments based on compounded overnight rates. These instruments have become the standard for derivatives discounting and provide key insights into central bank policy expectations and market stress levels
Interest rate movements can transform profitable loans into financial burdens overnight. Companies with floating-rate debt and bond investors face the same challenge: protecting against adverse rate shifts without sacrificing upside. This guide explains hedging instruments, duration strategies, and how to match protection to your specific exposure
The content on this website is provided for general informational and educational purposes only. It is intended to explain concepts related to Forex (FX) trading, currency markets, leverage, hedging, and risk management.
All information on this website, including articles, guides, and examples, is presented for general educational purposes. Forex trading carries significant risk, and outcomes may vary depending on market conditions, leverage, and individual decisions.
This website does not provide financial, investment, or trading advice, and the information presented should not be used as a substitute for consultation with qualified financial professionals.
The website and its authors are not responsible for any errors or omissions, or for any outcomes resulting from decisions made based on the information provided on this website.