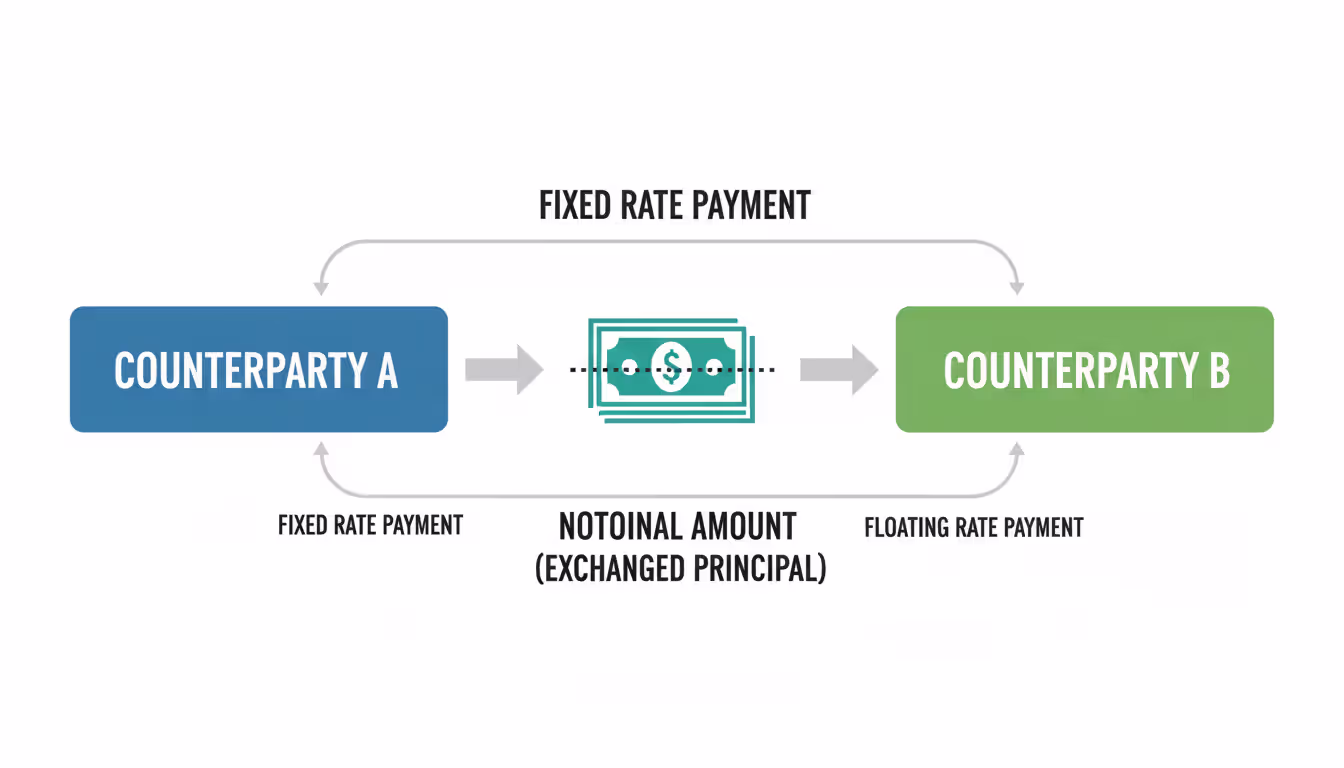
Here's the core idea behind an overnight index swap: it's a derivative where counterparties trade payment flows—one side locked in at a predetermined fixed rate, the other floating and tied to an overnight benchmark that compounds each business day. The principal amount? It's notional. Nobody actually exchanges it. What changes hands is just the net settlement reflecting which leg performed better.
These contracts now anchor how the financial world prices derivatives. Banks rely on them to manage their interest rate books. Asset managers use them to hedge duration. Corporations tap them to lock in borrowing costs or speculate on Federal Reserve decisions. The distinguishing feature—and it matters—is that the floating component resets every single day, tracking what overnight money actually costs in real-time markets rather than referencing some multi-month term rate.
Think about what happens when you lock in a fixed rate of 4.50% for a year on a $50 million swap. Over those twelve months, the overnight rate compounds daily. Maybe it averages 4.30% by the time you settle. You've overpaid by 20 basis points annualized, which works out to about $100,000 on that notional. Your counterparty pockets the difference. The swap essentially becomes a wager on the trajectory of short-term monetary policy stripped of any credit risk muddiness.
Understanding Overnight Index Swaps in Financial Markets
Let's walk through the structure. Counterparties start by agreeing on three elements: the notional size (say, $25 million), the tenor (perhaps three months), and the fixed rate (maybe 4.85%). On the floating side, they pick an overnight reference—today that's almost always SOFR in dollar markets, though the effective fed funds rate dominated before 2020.
Every trading day, that overnight rate gets pulled into the calculation and compounds geometrically. After three months, you've got a realized floating rate based on actual market conditions. If that compounded figure lands at 4.72%, the fixed-rate payer settles up for the 13-basis-point difference. Run the math on $25 million over 90 days, and that's roughly $8,100 changing hands.
Author: Olivia Kensington;
Source: martinskikulis.com
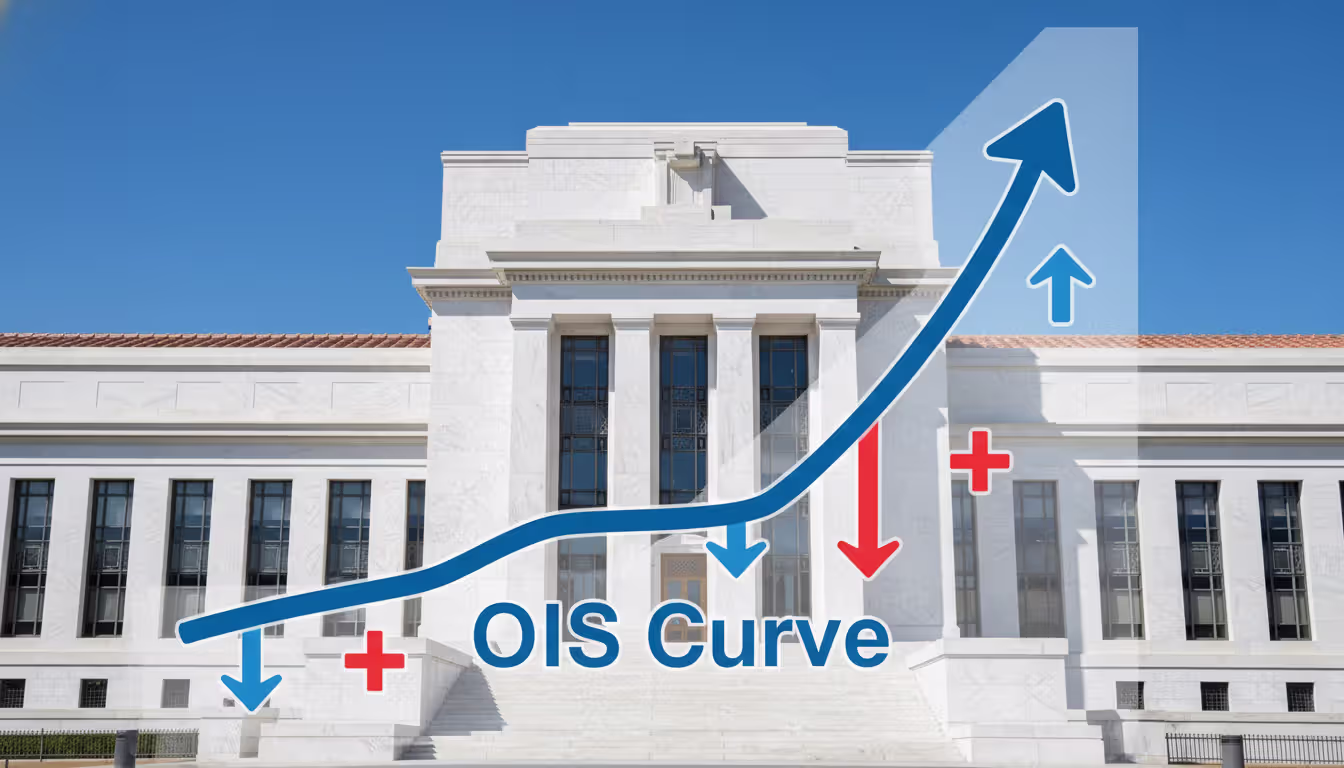
When traders talk about "the OIS rate," they mean the fixed side—what dealers will quote you for various maturities. Pull up a screen in 2026 and you'll see one-month OIS at 4.65%, six-month at 4.40%, one-year at 4.10%. That downward slope tells you the market expects rate cuts ahead. An upward-sloping curve? Tightening ahead.
The appeal boils down to this: you're isolating pure rate movement without worrying about whether your counterparty's credit deteriorates or their funding costs spike. Settlement happens frequently, and because the underlying rates track overnight secured lending or central bank-administered rates, credit contamination barely registers. That quality made OIS the obvious successor to flawed benchmarks that nearly broke markets in 2008.
How OIS Rates Reflect Central Bank Policy
The Fed sets a target range for fed funds—say, 4.25% to 4.50%—and the overnight rates that feed into OIS contracts immediately orbit that range. When the FOMC announces a quarter-point hike, markets reprice within minutes. OIS curves shift upward, locking in the new reality and adjusting expectations for subsequent moves.
Traders parse OIS quotes like tea leaves. Suppose one-month OIS sits 18 basis points above the current midpoint of the Fed's target. That gap signals heavy betting on a 25-basis-point increase at the next meeting. Compare the twelve-month OIS to today's policy rate and you've extracted the market's full-year forecast. In early 2024, for instance, OIS curves priced in roughly 150 basis points of cuts for 2024—turns out markets got ahead of themselves, but that's the predictive power embedded in these rates.
Why do OIS rates track central bank policy so precisely? Because the underlying overnight rates are either directly administered by the Fed (like interest on reserve balances) or anchored by facilities the Fed operates. SOFR reflects Treasury repo activity—overwhelmingly safe collateral. Even fed funds, though technically unsecured, clusters tightly around the target thanks to the Fed's operational framework.
Author: Olivia Kensington;
Source: martinskikulis.com
The Relationship Between OIS and Risk-Free Rates
Call OIS a risk-free rate proxy and you're on solid ground. SOFR, the most common floating leg component in 2026, comes from roughly $1 trillion daily in Treasury repo transactions. That's borrowing backed by U.S. government bonds. Default risk? Essentially zero. The Federal Reserve Bank of New York publishes it every morning based on previous day's trades.
Banks with surplus reserves lend overnight to institutions needing to satisfy reserve requirements. The Fed's standing repo facility and reverse repo facility create boundaries. Rates can't drift far from the target without triggering arbitrage. This architecture keeps effective rates stable regardless of individual bank creditworthiness.
The OIS curve's shape reveals where markets think policy is headed. Steep curves in mid-2022, before the Fed's hiking cycle ended, indicated expectations of sustained tightening. Inverted curves in late 2023 suggested traders believed cuts would arrive within six to twelve months. Portfolio managers watch these signals to adjust bond duration, swap overlays, and hedge ratios.
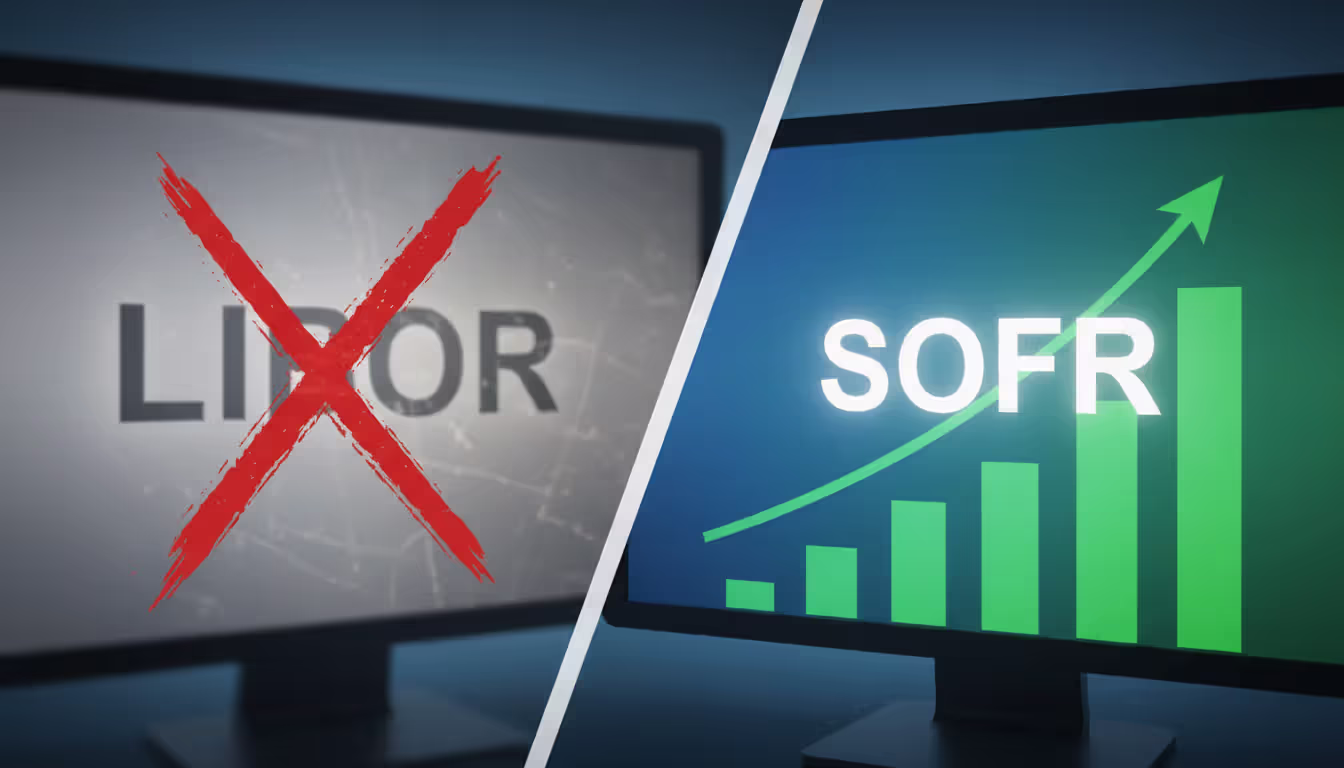
OIS vs LIBOR: Key Differences and Why Markets Shifted
LIBOR—remember it?—represented where banks claimed they could borrow unsecured funds from peers. Every morning, panel banks submitted estimates. An administrator trimmed the outliers, averaged what remained, and published rates for multiple currencies and tenors. Sounds reasonable until you realize submissions became guesses once actual interbank lending dried up.
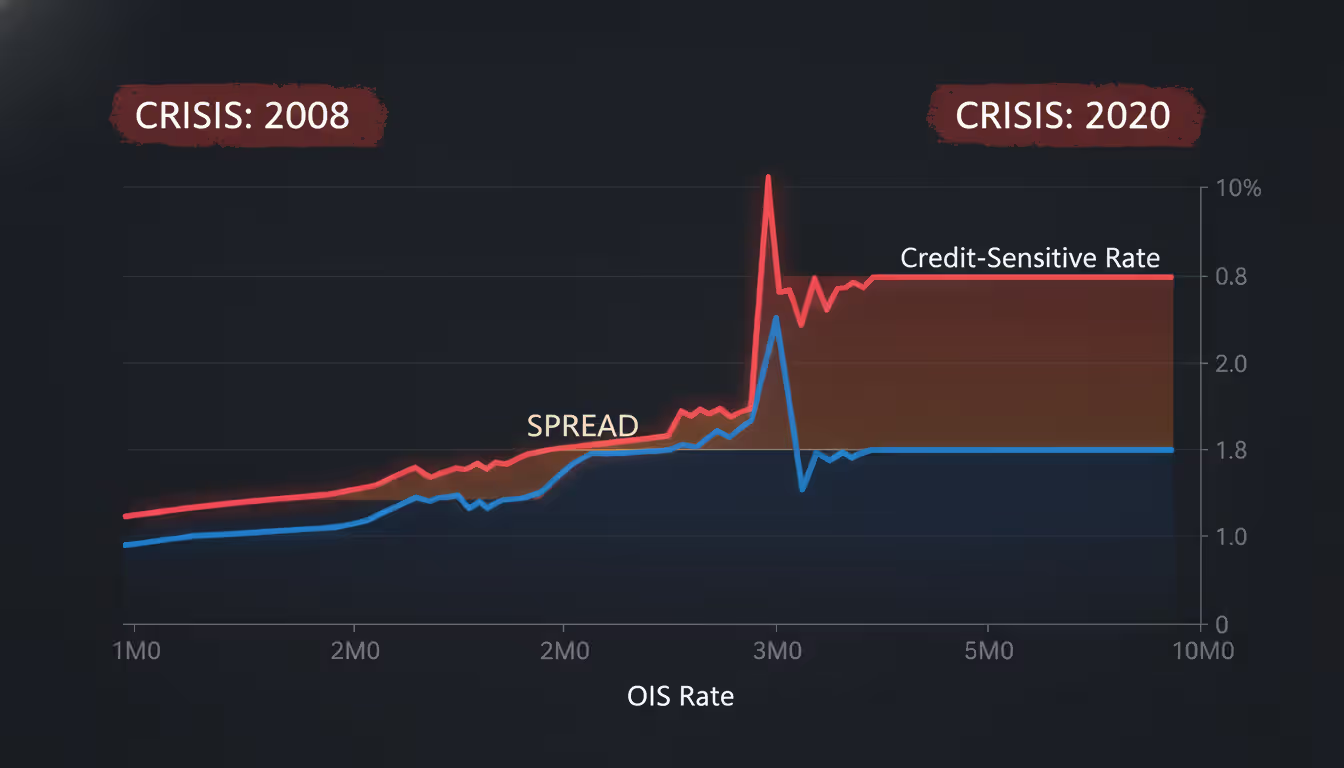
Credit risk poisoned LIBOR. During the 2008 panic, three-month LIBOR soared more than 350 basis points above equivalent OIS rates. Banks wouldn't lend to each other unsecured. Counterparty fear paralyzed markets. LIBOR reflected distress; OIS stayed anchored near policy rates because it tracked secured overnight transactions. The divergence exposed LIBOR's fundamental flaw: it measured credit risk plus term premium, not just the time value of money.
Then came the scandal. Traders at multiple banks manipulated LIBOR submissions to benefit their derivatives books or project false strength during the crisis. Regulators in the U.S., U.K., and E.U. levied billions in fines. Trust evaporated. U.K. authorities announced in 2017 they'd stop compelling submissions after 2021, effectively killing LIBOR.
Markets needed an alternative rooted in actual transactions, not estimates. SOFR emerged—constructed from observable repo trades, published by the New York Fed, impossible to manipulate without trading billions in Treasury markets. For derivatives, the transition proved less painful than feared because OIS discounting was already standard practice by 2015. Most dollar LIBOR publication ceased by mid-2023, with only synthetic rates lingering for legacy contracts.
The differences stack up clearly. LIBOR embedded bank credit risk and term liquidity premiums. OIS captures policy expectations with negligible credit noise. LIBOR came from a panel's best guesses. SOFR reflects real transaction volume. LIBOR required regulatory compulsion at the end. SOFR thrives on nearly $1 trillion in daily trades.
Author: Olivia Kensington;
Source: martinskikulis.com
How OIS Is Used in Derivatives Pricing and Discounting
Beyond the swaps themselves, OIS rates power valuation across derivatives markets. Before 2008, dealers discounted cash flows using LIBOR curves. Logic went: we fund at LIBOR, so future payments should be discounted at LIBOR. Made sense when credit was cheap and plentiful.
The crisis flipped that assumption. Banks started requiring collateral on derivatives trades—Credit Support Annexes became standard in ISDA master agreements. When you post cash collateral daily to cover mark-to-market movements, the relevant funding rate becomes what you earn (or pay) on that collateral. For dollar collateral, that's typically fed funds or SOFR, not some unsecured borrowing rate.
Markets pivoted to OIS discounting between 2010 and 2015. Now when a dealer values a five-year interest rate swap, they build a discount curve from OIS quotes across maturities. A payment due in three years gets discounted using the three-year OIS rate. This approach mirrors actual economic reality: collateral posted daily earns overnight rates, so discount factors should reflect overnight compounding.
OIS Discounting Explained for Collateralized Trades
Walk through a real scenario. A corporate client enters a ten-year swap receiving fixed and paying floating SOFR. The dealer must value this position daily. They project future SOFR payments using forward curves, then discount each payment back to present value using OIS-derived discount factors. A $1 million payment expected in seven years gets multiplied by a discount factor built from seven-year OIS rates.
Valuation shifts can be substantial when OIS and credit-sensitive rates diverge. During March 2020, three-month LIBOR-OIS spreads blew out past 130 basis points. Dealers still using LIBOR discounting for uncollateralized trades would show dramatically different values than those using OIS for collateralized positions. The methodology you choose matters—it can swing valuations by percentage points of notional on large books.
Plain-vanilla swaps in 2026 reference SOFR on the floating leg. The fixed rate quoted reflects the OIS curve at that maturity. A dealer quoting 4.15% on a five-year swap is essentially saying: based on current OIS markets, compounded SOFR should average close to 4.15% over the next five years. They hedge by entering offsetting OIS or trading SOFR futures.
Central clearinghouses—LCH, CME, Eurex—all adopted OIS discounting for cleared derivatives. This standardization eliminated valuation disputes and aligned cleared and bilateral markets. A swap cleared through LCH and one executed bilaterally now use the same discount methodology, assuming similar collateral terms.
OIS Spread: What It Reveals About Market Conditions
Author: Olivia Kensington;
Source: martinskikulis.com
Talk about "the OIS spread" and you're usually comparing a credit-sensitive or term rate against its equivalent OIS level. Historically, that meant three-month LIBOR versus three-month OIS. Nowadays, analysts might track spreads between term SOFR (the forward-looking rate for one or three months) and the equivalent OIS rate, or between bank commercial paper rates and OIS.
Widening spreads scream trouble. March 2020 provides the textbook example. Within three weeks, the LIBOR-OIS spread rocketed from roughly 20 basis points to over 130. Banks hoarded cash, uncertain about their own needs and wary of lending to peers. The Fed's emergency facilities—lending directly to primary dealers and buying commercial paper—eventually compressed spreads back below 50 basis points by late April.
Narrow spreads signal calm. In mid-2019, LIBOR-OIS sat around 12 basis points for months. Banks trusted each other. Funding was plentiful. Credit concerns barely registered. Markets functioned smoothly enough that the spread became an afterthought.
When spreads widen sharply, several consequences ripple through markets. Banks' funding costs jump relative to risk-free rates, squeezing margins. Corporations with floating-rate loans tied to credit-sensitive benchmarks see interest expenses climb. Derivatives desks scramble to adjust hedges as basis risk (the gap between what they're paying on funding and receiving on swaps) explodes. Volatility surges across rates products.
The spread has historically served as a real-time stress indicator. In normal conditions, it reflects the modest credit and term premium of interbank lending—call it 10 to 20 basis points. Cross 50 and people start worrying. Break 100 and you're in crisis territory. With LIBOR gone, market participants monitor alternative spreads—bank CD rates versus OIS, FRA-OIS spreads, or term SOFR versus compounded OIS—to gauge funding stress.
SOFR vs OIS: Understanding Today's Rate Benchmarks
Adopting OIS as the universal discount curve marked the biggest transformation in how we value derivatives since the market's inception. Aligning valuations with the real economics of collateral eliminated huge inconsistencies and made the system more resilient. The industry's rapid convergence on this standard, despite implementation headaches, showed we could rally around robust, transaction-based benchmarks when necessary
— Dr. Edwin Truman
Confusion arises because SOFR appears in two contexts. First, it's an overnight rate—the Federal Reserve publishes it daily as the volume-weighted median of Treasury repo transactions. Second, it's the floating leg of OIS contracts. So when someone asks "SOFR vs OIS," they're really asking about SOFR the rate versus OIS the derivative instrument, or perhaps comparing term SOFR (a forward-looking derivative rate) to OIS levels.
Let's clarify. OIS contracts in dollar markets now predominantly use SOFR on the floating side. Each day, SOFR compounds. The fixed leg represents where the market thinks compounded SOFR will average over the swap's life. In this sense, OIS and SOFR are inseparable—one is the vehicle, the other is the underlying index.
SOFR comes in variants. Daily SOFR is the raw overnight rate—4.83% one day, 4.81% the next. Compounded SOFR takes the geometric average of those daily figures over a specified period, which is exactly what the floating leg of an OIS calculates. Then there's term SOFR: CME Group publishes forward-looking one-month and three-month rates derived from SOFR futures and OIS markets. Some loan markets prefer term rates because borrowers want to know their rate at the period's start, not in arrears.
For derivatives and discounting, compounded SOFR via OIS remains the gold standard. Cleared swaps reference it. Discounting uses curves built from OIS. Bilateral CSAs specify it for collateral interest. The liquidity is deepest across the full maturity spectrum—you can trade OIS from overnight out to thirty years with reasonable bid-ask spreads.
The post-LIBOR landscape circa 2026 looks like this: SOFR dominates dollar markets. OIS referencing SOFR provides hedging, speculation, and discount curves. Term SOFR serves niche uses in cash markets where forward-looking rates make operational sense. Other currencies run parallel systems—€STR underpins euro OIS, SONIA does the same in sterling, TONAR in yen. Each has deep, liquid OIS markets tied to local central bank frameworks.
Comparison: OIS, LIBOR, and SOFR
Aspect
OIS (Overnight Index Swap)
LIBOR (Phased Out)
SOFR (Current Benchmark)
Credit risk profile
Minimal—linked to secured overnight rates or central bank policy
Moderate to high—reflected unsecured bank borrowing
Minimal—backed by Treasury collateral
How it's calculated
Derivative paying fixed vs. compounded overnight floating
Panel submissions trimmed and averaged
Transaction-based median from ~$1T daily repo volume
How often published
Dealers quote fixed rates continuously during trading
Loan benchmarks, floating debt, swap floating legs
Regulatory standing in 2026
Standard for all collateralized derivative discounting globally
Discontinued except synthetic USD LIBOR for legacy
Officially endorsed USD LIBOR replacement
Frequently Asked Questions
Why is OIS considered a risk-free rate?
OIS tracks overnight benchmarks rooted in secured borrowing or central bank operations. SOFR, for instance, comes from Treasury repo trades—lending backed by U.S. government bonds where default risk barely exists. The daily reset and frequent settlement also minimize counterparty exposure. This combination makes OIS the practical proxy for "risk-free" in markets, even though technically only sovereign debt itself is truly risk-free.
How often are OIS rates published?
There's no single daily OIS publication like SOFR. Instead, dealers quote OIS fixed rates continuously during market hours for different maturities—overnight, one week, one month, three months, all the way to multi-decade tenors. These quotes represent the fixed rate at which they'll enter swaps. The underlying rates like SOFR publish daily (New York Fed releases it around 8 a.m. ET), but the swap quotes themselves trade live all day.
What happens when the OIS spread widens?
Widening spreads between credit-sensitive rates and OIS signal funding stress. Banks face higher borrowing costs relative to risk-free levels. Liquidity dries up as institutions hoard cash. Counterparty worry intensifies. Markets saw this in October 2008 when LIBOR-OIS hit 364 basis points, and again in March 2020 when spreads topped 130 basis points before Fed interventions. Narrow spreads mean calm; wide spreads mean somebody's panicking.
Can individual investors trade overnight index swaps?
Retail investors can't directly access OIS markets—these trade OTC between banks, asset managers, hedge funds, and corporates, or clear through institutional CCPs. But you can get indirect exposure. Money market ETFs holding Treasury bills or government repo essentially earn rates close to OIS. SOFR futures on CME let you take positions on rate movements. Some structured notes or leveraged loan ETFs might embed OIS-linked components. Direct access remains institutional only.
How did OIS replace LIBOR in derivatives pricing?
The shift happened because collateral changed the economics. Once CSAs became standard, requiring daily cash posting to cover exposure, the relevant funding cost became overnight rates earned on collateral—not unsecured term borrowing rates. Dealers started using OIS discounting for collateralized trades around 2010-2012. Industry groups and regulators formalized this through the 2010s. By the time LIBOR died in 2023, OIS discounting was universal and the transition barely registered in derivatives markets.
What is the difference between OIS and federal funds rate?
The federal funds rate is an actual overnight rate—what banks charge each other to borrow reserve balances, with the Fed targeting a specific range. An overnight index swap is a derivative contract where one leg references such an overnight rate. The fed funds rate can be the underlying index for an OIS (historically common), though SOFR has largely replaced it in new contracts. So fed funds is an input; OIS is a financial instrument built around compounding that input over time.
Overnight index swaps evolved from specialized interest rate derivatives into the infrastructure supporting modern finance. They capture market sentiment on central bank policy with minimal noise. They provide the discount curves that value trillions in collateralized derivatives. They offer hedging precision that term-based benchmarks can't match.
The journey from LIBOR's collapse to SOFR's dominance reinforced OIS's centrality. Markets needed benchmarks grounded in actual overnight transactions, not panel estimates or credit-contaminated rates. OIS contracts naturally accommodate such benchmarks—compounding daily, settling frequently, isolating pure rate exposure.
Spreads between OIS and credit-sensitive alternatives continue offering early warnings when funding stress builds. The curves themselves function as consensus forecasts of monetary policy trajectories. For institutions managing billions in rate-sensitive positions, OIS instruments deliver the transparency and reliability that regulators demanded post-crisis.
As 2026 progresses and LIBOR fades further into history, overnight index swaps stand as the enduring solution—transaction-based, risk-minimized, and aligned with how collateralized derivatives actually work. Their role in pricing, hedging, and policy analysis will only deepen as markets prioritize robust, observable benchmarks over legacy constructs that couldn't survive scrutiny.
Swap rates represent the interest cost or credit applied when forex traders hold positions past the daily rollover time. Understanding how these overnight fees work, when you pay or earn them, and their cumulative impact is essential for swing traders and anyone implementing carry trade strategies in 2026
Spread betting lets you speculate on market moves without owning the asset. This guide walks through real examples—long and short positions, forex pairs, margin calculations—showing exactly how profits and losses accumulate, how to size stakes responsibly, and what happens when trades go wrong
Interest rate movements can transform profitable loans into financial burdens overnight. Companies with floating-rate debt and bond investors face the same challenge: protecting against adverse rate shifts without sacrificing upside. This guide explains hedging instruments, duration strategies, and how to match protection to your specific exposure
Interest rate arbitrage exploits interest differentials between countries to generate profit. This comprehensive guide explains covered and uncovered strategies, carry trades, why covered arbitrage is considered risk-free, and the real-world constraints that limit arbitrage opportunities in modern currency markets
The content on this website is provided for general informational and educational purposes only. It is intended to explain concepts related to Forex (FX) trading, currency markets, leverage, hedging, and risk management.
All information on this website, including articles, guides, and examples, is presented for general educational purposes. Forex trading carries significant risk, and outcomes may vary depending on market conditions, leverage, and individual decisions.
This website does not provide financial, investment, or trading advice, and the information presented should not be used as a substitute for consultation with qualified financial professionals.
The website and its authors are not responsible for any errors or omissions, or for any outcomes resulting from decisions made based on the information provided on this website.