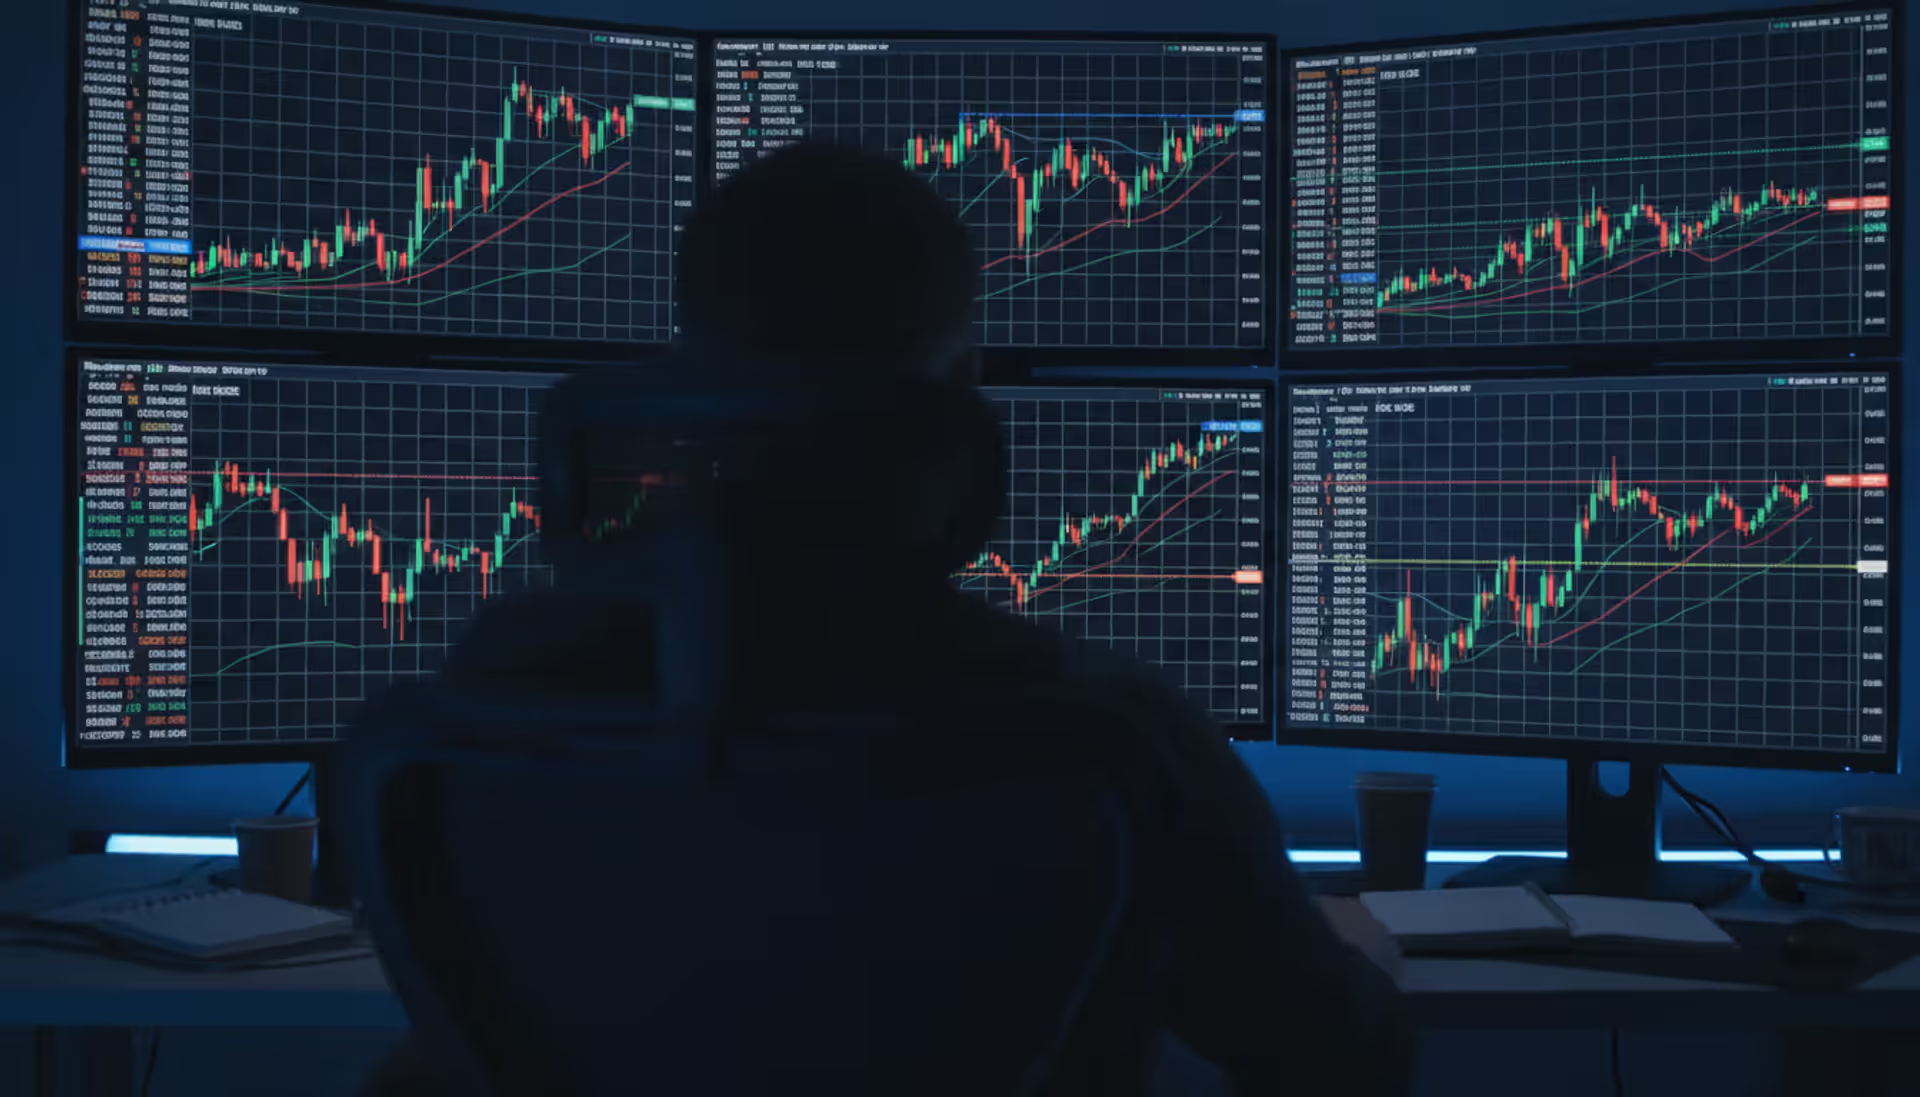
Professional forex trader analyzing multiple currency pair charts on monitors showing correlated and inversely correlated price movements in a modern trading workspace
Author: Marcus Ellington;Source: martinskikulis.com
Understanding how currency pairs move in relation to each other can mean the difference between a balanced portfolio and unnecessary risk exposure. Forex correlation reveals these hidden relationships, helping traders make informed decisions about position sizing, hedging, and diversification.
When two currency pairs consistently move in the same direction, or reliably move opposite to each other, that pattern creates trading opportunities—and potential pitfalls. Ignoring these relationships often leads traders to unknowingly double their risk or miss natural hedging opportunities sitting right in front of them.
What Currency Correlation Means in Forex Trading
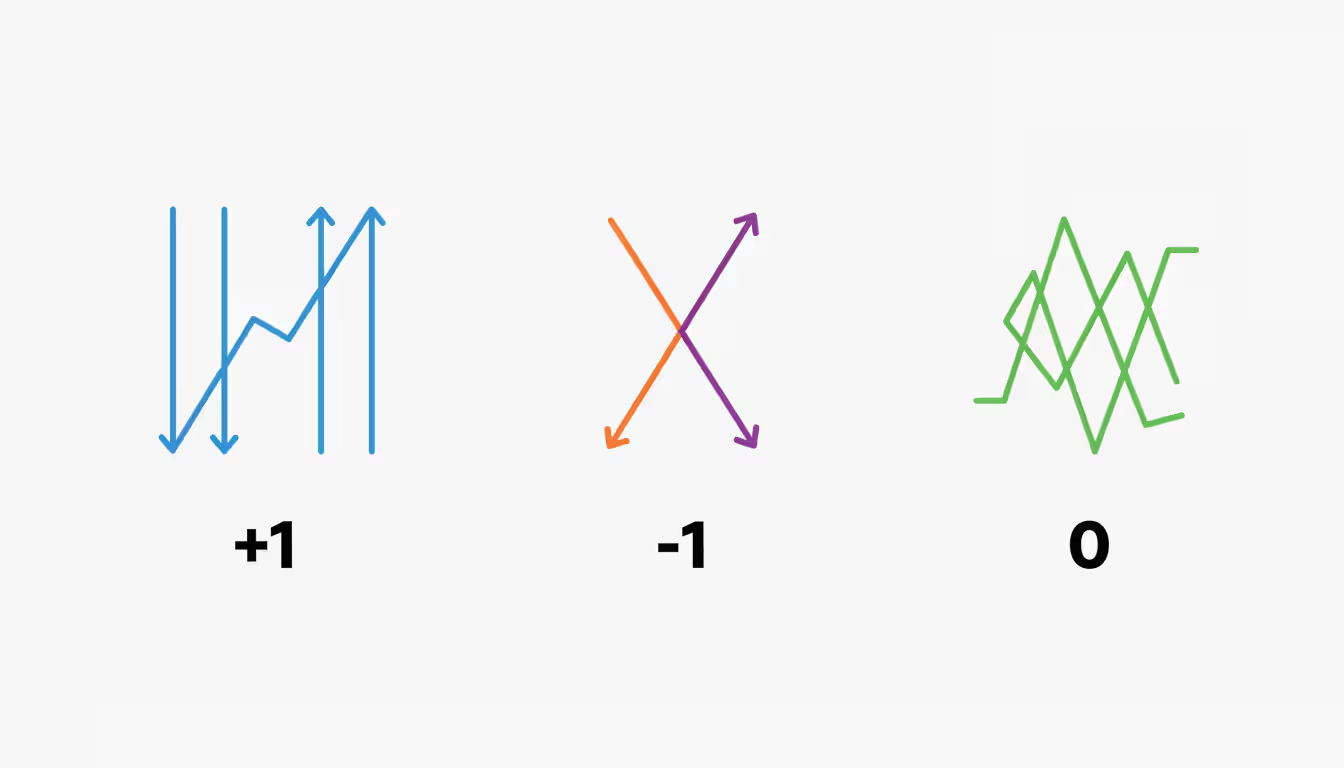
Currency correlation measures the statistical relationship between two currency pairs. The correlation coefficient expresses this relationship as a number between -1 and +1, showing both the strength and direction of the connection.
A correlation of +1 represents perfect positive correlation—when one pair moves up by 50 pips, the other moves up by approximately the same amount. A correlation of -1 indicates perfect negative correlation, where pairs move in exact opposite directions. A correlation near 0 means the pairs move independently with no predictable relationship.
Real-world correlations rarely hit perfect +1 or -1. Most fall somewhere in between. EUR/USD and GBP/USD typically show a correlation around +0.85, meaning they move together about 85% of the time but occasionally diverge. USD/CHF and EUR/USD historically maintain a correlation near -0.95, moving opposite directions with high consistency.
The correlation coefficient forex traders use is calculated over a specific timeframe—typically 20 days, 60 days, or 250 days. Shorter periods capture recent market dynamics but can be volatile. Longer periods smooth out noise but may miss recent shifts in market behavior.
Think of correlation as a weather pattern, not a law of physics. Just because two pairs moved together last month doesn't guarantee they'll continue that relationship. Economic announcements, central bank policy shifts, and geopolitical events can break established correlations within hours.
Author: Marcus Ellington;
Source: martinskikulis.com
How Positive and Negative Correlations Work Between Pairs
Positive correlation occurs when two currency pairs move in the same direction. EUR/USD and GBP/USD demonstrate this relationship because both pairs share the US dollar as the quote currency and both base currencies (euro and British pound) are major European currencies with interlinked economies.
When the Federal Reserve signals interest rate changes, both pairs typically react similarly. If the dollar weakens on dovish Fed comments, both EUR/USD and GBP/USD tend to rise. A trader holding long positions in both pairs isn't diversifying—they're essentially doubling down on the same bet against the dollar.
Negative correlation in forex appears when pairs move in opposite directions. The classic example is EUR/USD and USD/CHF. When EUR/USD rises, USD/CHF typically falls. This happens because both pairs share common currencies: the euro and Swiss franc historically move together due to Switzerland's economic ties to the Eurozone, while the dollar occupies opposite sides of each pair.
If EUR/USD climbs from 1.0800 to 1.0850, you'll often see USD/CHF drop from 0.8900 to 0.8850 during the same period. Traders holding long EUR/USD and short USD/CHF positions are taking nearly identical bets—if the dollar strengthens unexpectedly, both positions lose simultaneously.
Here's how common currency pairs and assets typically correlate:
Pair/Asset 1
Pair/Asset 2
Typical Correlation
Relationship Type
EUR/USD
USD/CHF
-0.95
Strong Negative
EUR/USD
GBP/USD
+0.85
Strong Positive
USD/CAD
Crude Oil
-0.80
Strong Negative
AUD/USD
Gold
+0.75
Strong Positive
EUR/USD
USD/JPY
-0.60
Moderate Negative
GBP/USD
USD/CHF
-0.85
Strong Negative
NZD/USD
AUD/USD
+0.90
Strong Positive
These correlations shift over time. During the European debt crisis, EUR/USD and GBP/USD correlation weakened as markets differentiated between Eurozone and UK risks. During the 2025 commodity price surge, oil and CAD correlation strengthened beyond historical norms.
Correlation strength matters as much as direction. A correlation of +0.30 indicates a weak positive relationship—the pairs sometimes move together, but other factors dominate their price action. Correlations above +0.70 or below -0.70 represent strong relationships worth incorporating into trading decisions.
Major Forex and Commodity Correlations Every Trader Should Know
EUR/USD and USD/CHF Relationship
The EUR/USD and USD/CHF correlation ranks among the most reliable in forex markets. Switzerland's economy depends heavily on Eurozone trade, creating a natural link between the euro and Swiss franc. When the euro strengthens against the dollar, the franc typically strengthens too—but since USD/CHF has the dollar as the base currency, this pair falls.
This relationship proved particularly strong after the Swiss National Bank abandoned its euro peg in 2015, though the correlation coefficient has stabilized near -0.95 in recent years. Traders sometimes use this relationship for confirmation—if EUR/USD breaks resistance but USD/CHF doesn't break corresponding support, the move might lack conviction.
One practical application: if you're long EUR/USD and want to hedge dollar exposure without closing your position, shorting USD/CHF provides a natural offset. Your profit and loss become less dependent on dollar movements and more focused on euro-franc dynamics.
Oil Prices and the Canadian Dollar
Canada exports roughly 4 million barrels of crude oil daily, making petroleum Canada's largest export by value. When oil prices rise, Canadian trade balance improves, strengthening demand for Canadian dollars. This creates a strong negative correlation between USD/CAD and crude oil prices, typically ranging from -0.75 to -0.85.
The correlation strengthens during major oil price moves. When crude crashed below $20 per barrel in early 2020, USD/CAD spiked above 1.45. As oil recovered to $80+ in 2021-2022, USD/CAD fell back toward 1.25. In 2026, with oil prices stabilizing around $75-85 per barrel, the correlation remains intact but less volatile.
Traders watch this relationship for divergence opportunities. If oil rallies 10% but USD/CAD barely moves, either oil will correct or the loonie will catch up. These divergences don't last long—arbitrage and fundamental flows typically restore the relationship within days or weeks.
One nuance: the correlation weakens when other factors dominate. If the Federal Reserve aggressively hikes rates while the Bank of Canada holds steady, USD/CAD might rise despite stable oil prices. Interest rate differentials can temporarily override commodity correlations.
Author: Marcus Ellington;
Source: martinskikulis.com
Gold and the US Dollar Connection
Gold traditionally moves inversely to the US dollar, with correlations between gold and EUR/USD typically around +0.70 to +0.80. When the dollar weakens, gold becomes cheaper for holders of other currencies, increasing demand and pushing prices higher. Gold's role as an inflation hedge also creates negative correlation with the dollar during periods of dollar debasement concerns.
This relationship isn't mechanical. During the 2025 banking stress, both gold and the dollar rallied together as investors sought safety. Gold hit $2,400 per ounce while the dollar index climbed above 105—a temporary breakdown of typical correlation as fear dominated markets.
For forex traders, gold correlation offers a cross-market confirmation tool. If EUR/USD rallies but gold remains flat or falls, the euro's strength might be temporary or driven by factors other than dollar weakness. Conversely, when gold and EUR/USD both surge, dollar weakness is likely the common driver.
Australian dollar correlation with gold runs even stronger, often exceeding +0.80. Australia ranks as the world's second-largest gold producer, and AUD/USD movements frequently mirror gold price trends. Traders sometimes use gold futures as a leading indicator for AUD/USD direction, especially during Asian trading hours when forex liquidity is lower.
How Correlations Affect Your Forex Trading Strategy
Correlation analysis transforms how traders approach position sizing and risk management. A trader who goes long EUR/USD and GBP/USD thinking they've diversified across two positions has actually concentrated risk—both positions profit or lose based largely on dollar strength.
Hedging opportunities emerge naturally from negative correlations. A portfolio manager concerned about short-term dollar volatility might hold equal long positions in EUR/USD and USD/CHF. When the dollar moves, gains in one position roughly offset losses in the other, creating a hedge against dollar movements while maintaining exposure to euro-franc dynamics.
This hedging isn't free. Spread costs double when you trade two pairs instead of one, and correlations don't provide perfect hedges. A -0.90 correlation means pairs move opposite 90% of the time—but that remaining 10% can surprise you.
Predicting pair movements becomes more reliable when multiple correlated assets confirm a direction. If crude oil breaks out to new highs, gold rallies, and the dollar index breaks support, these signals collectively suggest USD/CAD should fall and EUR/USD should rise. Trading with correlation confirmation reduces false signals.
Understanding correlation is essential for professional risk management.Retail traders often think they're diversified across five currency positions, but correlation analysis reveals they're really making one or two underlying bets. Recognizing this prevents the illusion of diversification that leads to outsized losses during market stress
— Dr. Michael Chen
Correlation also helps identify unusual market conditions. When historically correlated pairs diverge significantly, something fundamental has shifted. During the 2024 energy crisis, USD/CAD and oil correlation temporarily weakened as Canadian natural gas exports to the US created offsetting dollar demand. Traders who recognized this divergence avoided confusion when their oil-based CAD predictions failed.
Some traders deliberately seek low or negative correlations to build truly diversified portfolios. Combining EUR/USD (correlated with gold and European equities) with USD/JPY (correlated with risk sentiment and Japanese trade flows) creates more independent return streams than combining EUR/USD and GBP/USD.
Using Correlation for Risk Diversification and Portfolio Management
Building a balanced forex portfolio requires understanding how correlations affect total risk exposure. Two positions with +0.90 correlation essentially function as one position—if you risk 2% per trade, you're actually risking nearly 4% on the same underlying move.
Risk diversification using correlation starts with calculating your actual exposure. If you're long 1 standard lot EUR/USD and 1 standard lot GBP/USD, and these pairs show +0.85 correlation, your effective exposure is roughly 1.85 lots on dollar weakness, not 2 separate bets. Your account risk is higher than position sizes suggest.
Smart portfolio construction seeks pairs with low correlation. A portfolio combining EUR/USD (+0.85 correlation with gold), USD/JPY (-0.40 correlation with gold), and AUD/NZD (+0.20 correlation with gold) spreads risk across different market drivers. The European Central Bank affects EUR/USD, Bank of Japan policy drives USD/JPY, and Australia-New Zealand interest rate differentials move AUD/NZD.
Calculating correlation coefficient in practice requires historical price data and basic statistics. Most trading platforms include correlation tools, but you can calculate manually using Excel or Python. Take daily closing prices for two pairs over your chosen period (60 days is common), calculate daily returns, then use the CORREL function or equivalent.
Manual calculation reveals important details automated tools might hide. If correlation averaged +0.80 over 60 days but was only +0.40 in the most recent 20 days, the relationship is weakening. Trading decisions based on outdated correlations lead to unexpected results.
Portfolio rebalancing based on correlation shifts prevents risk concentration. A trader might start the year with equal positions across six pairs showing low intercorrelation. Three months later, market conditions change and four pairs now move together. Without rebalancing, what began as diversified exposure has become concentrated risk.
Practical rule of thumb: avoid holding more than two positions with correlations above +0.75 or below -0.75. If you must hold correlated positions, reduce position sizes proportionally. Instead of risking 2% on each of two highly correlated trades, risk 1.25% each—your total risk remains near 2% after accounting for correlation.
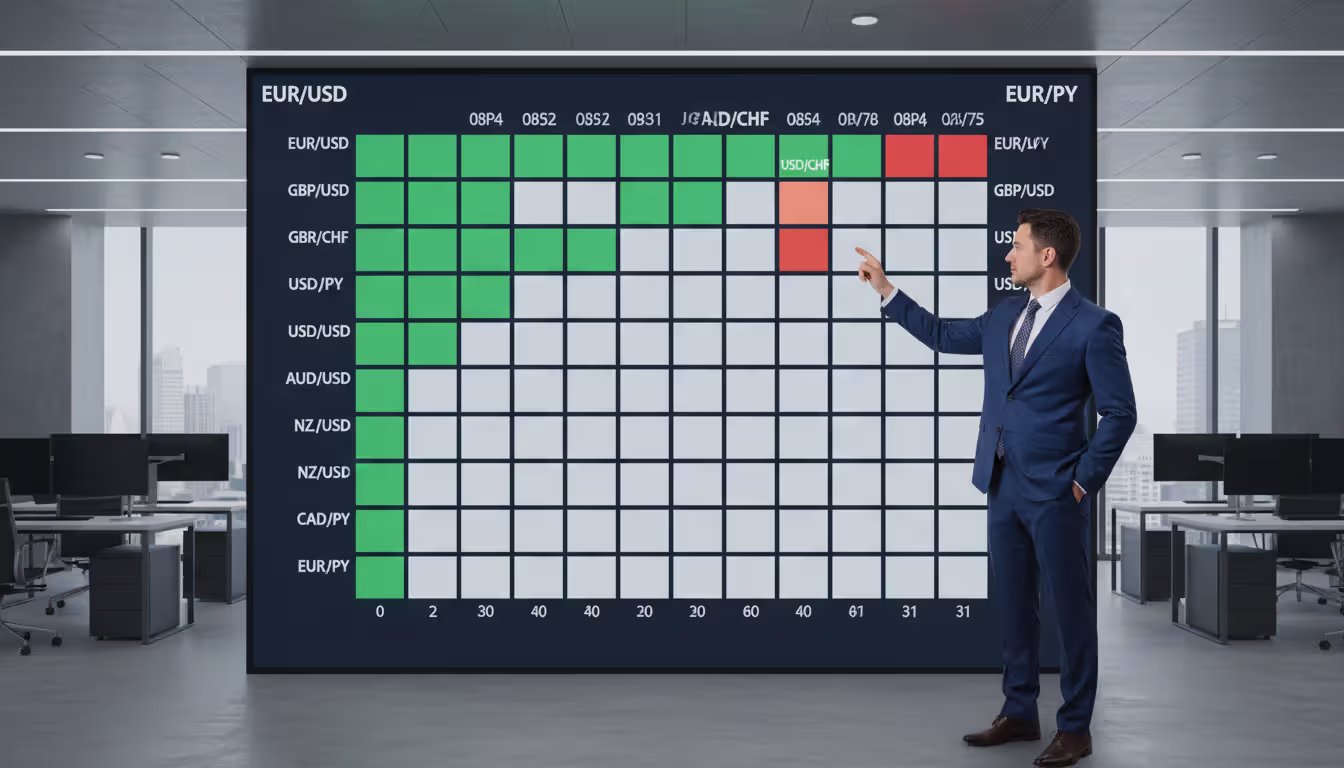
Correlation matrices help visualize relationships across multiple pairs. Create a table showing correlations between every pair you trade. Patterns emerge: you might discover all your positions correlate with oil prices, or that you're inadvertently making multiple bets on Fed policy through different currency combinations.
Author: Marcus Ellington;
Source: martinskikulis.com
Common Mistakes When Trading Forex Correlations
The biggest mistake traders make is assuming correlations remain stable. Market relationships shift as economic conditions evolve. The USD/CAD and oil correlation that held firm for years can weaken within weeks if Canadian economic drivers diversify or US energy policy changes dramatically.
Checking correlations once and trading that assumption for months guarantees problems. Correlations should be recalculated at least monthly, and more frequently during volatile periods or major policy shifts. The 2025 AI boom altered several traditional correlations as technology sector flows began dominating certain currency movements.
Overreliance on historical data creates another trap. A correlation coefficient of +0.85 over the past year doesn't predict tomorrow's price action—it describes what already happened. Correlations are backward-looking statistics, not forward guarantees. They inform probabilities but don't eliminate uncertainty.
Traders often confuse correlation with causation. Just because EUR/USD and gold move together doesn't mean one causes the other. Both might respond to a third factor—dollar strength—without directly influencing each other. This distinction matters when trying to predict moves: gold rallying doesn't cause EUR/USD to rise, but both might rise together when the dollar weakens.
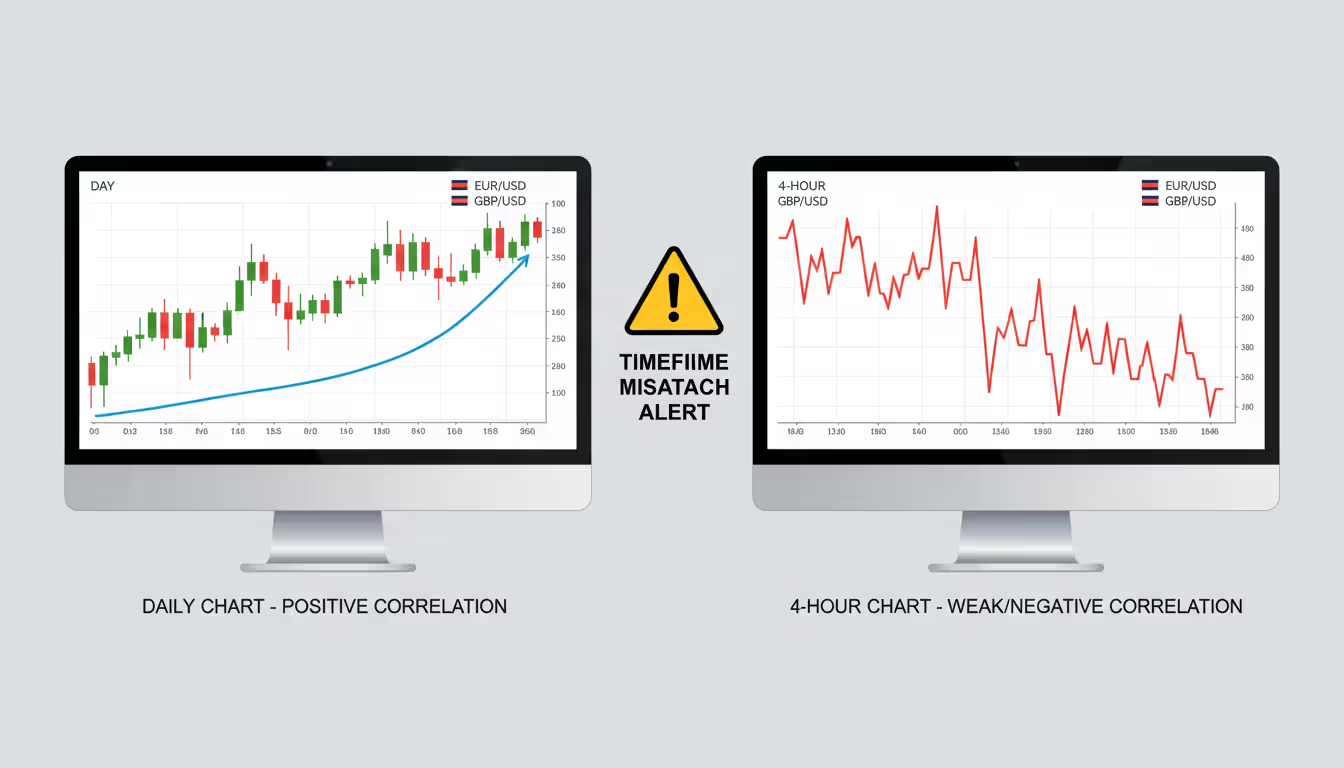
Another error is ignoring timeframe differences. Pairs might show strong correlation on daily charts but weak correlation on 4-hour charts. A day trader using daily correlation data makes decisions based on irrelevant information. Match your correlation analysis timeframe to your trading timeframe.
Some traders overhedge, creating positions that can't profit regardless of market direction. Going long EUR/USD and short USD/CHF in equal sizes with -0.95 correlation means you've essentially created a zero-sum position. Small spread and commission costs guarantee a loss. Hedging should reduce risk while maintaining profit potential, not eliminate both.
Author: Marcus Ellington;
Source: martinskikulis.com
Failing to account for correlation changes during major news events causes unexpected losses. Correlations often break down temporarily during high-impact announcements. The EUR/USD and GBP/USD correlation might weaken significantly if the Bank of England surprises markets while the ECB meets expectations. Trading correlation patterns through major news risks getting caught in temporary divergences.
Frequently Asked Questions About Forex Correlation
What does a correlation of +1 mean in forex?
A correlation of +1 indicates perfect positive correlation, meaning two currency pairs move in exactly the same direction and magnitude. If one pair rises 50 pips, the other rises 50 pips. In practice, perfect +1 correlations don't exist in forex markets. Real-world correlations typically range from +0.70 to +0.95 for strongly correlated pairs, with occasional divergences caused by pair-specific factors.
Can currency correlations change over time?
Yes, correlations change frequently based on economic conditions, monetary policy, and market sentiment. A pair showing +0.80 correlation over six months might drop to +0.40 over the next six months as underlying fundamentals shift. Major events like policy changes, commodity price shocks, or financial crises can alter correlations within days. Successful traders recalculate correlations regularly rather than relying on outdated relationships.
How do I calculate correlation between two forex pairs?
Most trading platforms include built-in correlation tools, but you can calculate manually using spreadsheet software. Collect daily closing prices for both pairs over your chosen period (20, 60, or 250 days are common). Calculate the daily percentage change for each pair. Use the CORREL function in Excel or similar statistical functions to find the correlation coefficient. The result will be a number between -1 and +1 indicating the strength and direction of the relationship.
Should I avoid trading highly correlated pairs?
Not necessarily, but you should adjust position sizing and recognize you're not diversifying risk. Trading two pairs with +0.90 correlation is essentially making one larger bet, so your combined position size should reflect this. Highly correlated pairs can be useful for confirmation—if both pairs signal the same trade setup, conviction increases. Just don't treat them as independent positions when calculating risk exposure.
What's the difference between positive and negative correlation?
Positive correlation means pairs move in the same direction—when one rises, the other typically rises too. EUR/USD and GBP/USD show positive correlation. Negative correlation means pairs move in opposite directions—when one rises, the other typically falls. EUR/USD and USD/CHF demonstrate negative correlation. The numerical value indicates strength: +0.90 is strongly positive, -0.90 is strongly negative, and values near 0 indicate little relationship.
How does correlation help with risk management?
Correlation reveals hidden risk concentration. A trader holding five positions might think they're well-diversified, but if all five pairs show strong positive correlation, they're really making one bet with 5x leverage. Understanding correlation helps you build truly diversified portfolios where positions respond to different market drivers. You can also use negative correlation for hedging, taking offsetting positions that reduce overall portfolio volatility while maintaining profit potential.
Forex correlation provides a framework for understanding how currency pairs and related assets move together or apart. The correlation coefficient—ranging from -1 to +1—quantifies these relationships, helping traders avoid hidden risk concentration and identify natural hedging opportunities.
Strong positive correlations like EUR/USD and GBP/USD mean traders holding both positions aren't diversified but concentrated. Strong negative correlations like EUR/USD and USD/CHF create hedging possibilities but also mean you're essentially making the same trade from different angles. Commodity correlations—oil with CAD, gold with the dollar—offer cross-market confirmation and leading indicators.
The key to using correlation effectively is remembering these relationships shift over time. What worked last quarter might not work today. Regular recalculation, awareness of changing market conditions, and avoiding the correlation-equals-causation fallacy keep your analysis relevant.
Smart portfolio construction balances correlated and uncorrelated positions, adjusting position sizes to reflect true risk exposure rather than simply counting open trades. This approach prevents the illusion of diversification that leaves traders overexposed during market stress. Correlation analysis doesn't guarantee profits, but it does help you understand exactly what bets you're making—and that clarity makes all the difference in long-term trading success.
The pound to dollar exchange rate reflects economic health, central bank policy, and political stability. This guide explains what drives Cable, historical context, purchasing power parity, seasonal patterns, and expert forecasts for 2026 to help Americans make informed currency decisions
Non-Farm Payroll releases create dramatic currency market swings on the first Friday of most months. Learn what NFP means for forex traders, how employment data drives USD volatility, and proven strategies for trading this high-impact economic event safely and profitably
The British pound has traded within 1.2450-1.2850 against the dollar through early 2026, reflecting balanced fundamentals. Interest rate differentials, inflation dynamics, and Brexit's lasting impact shape the pair's outlook, with major banks forecasting modest weakness toward 1.2400 over 12 months
Forex volatility describes the rate and magnitude of price changes in currency pairs. This guide covers measurement methods like ATR and historical volatility, explores factors driving volatility including news events and VIX correlation, and provides practical strategies for trading both high and low volatility conditions
The content on this website is provided for general informational and educational purposes only. It is intended to explain concepts related to Forex (FX) trading, currency markets, leverage, hedging, and risk management.
All information on this website, including articles, guides, and examples, is presented for general educational purposes. Forex trading carries significant risk, and outcomes may vary depending on market conditions, leverage, and individual decisions.
This website does not provide financial, investment, or trading advice, and the information presented should not be used as a substitute for consultation with qualified financial professionals.
The website and its authors are not responsible for any errors or omissions, or for any outcomes resulting from decisions made based on the information provided on this website.