Traders who rely on gut feelings or incomplete information rarely survive long in the forex market. Historical data transforms speculation into evidence-based decision-making, offering a window into how currency pairs behaved under different market conditions. Whether you're building automated strategies or refining discretionary approaches, understanding how to source, interpret, and apply historical forex data separates consistent performers from those who stumble through trial and error.
What Is Forex Historical Data and Why It Matters
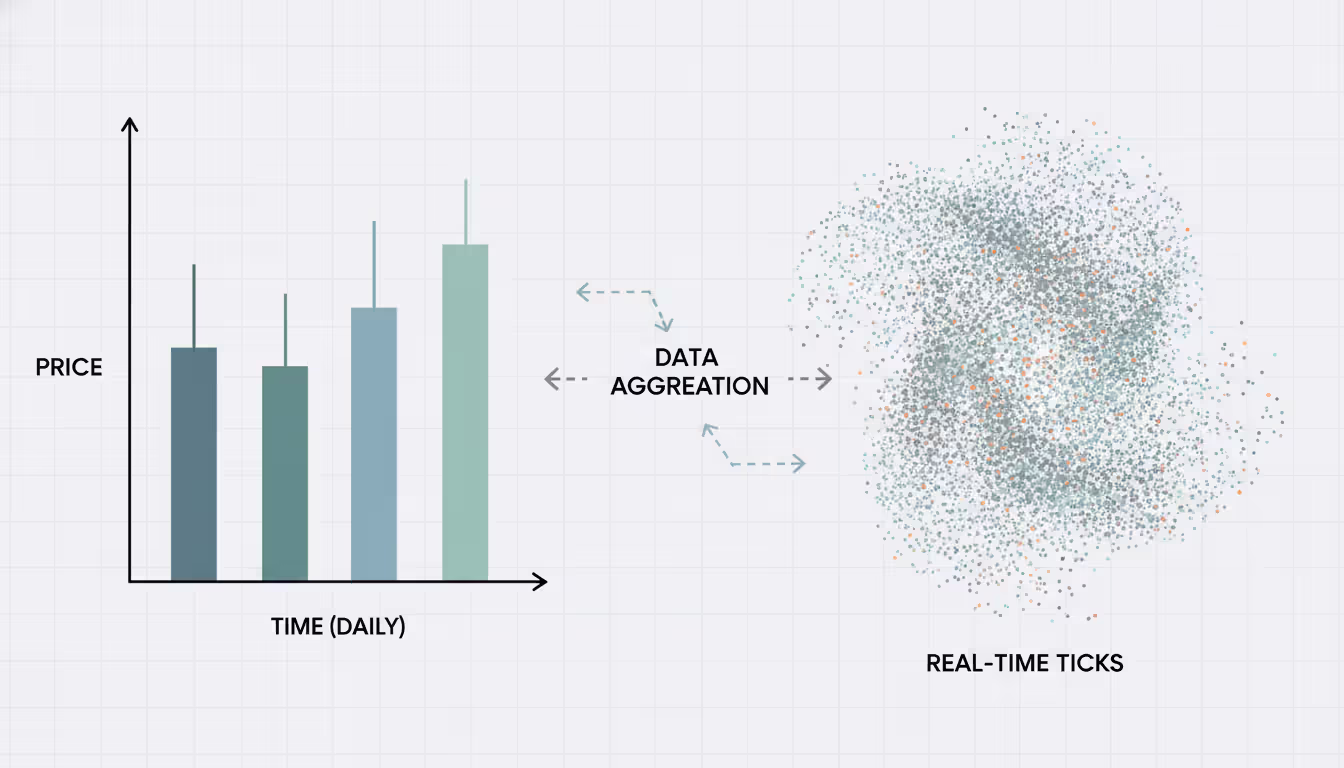
Forex historical data comprises timestamped records of currency pair price movements, volume metrics, and liquidity indicators collected over weeks, months, or decades. At its core, this data captures four essential price points for any given period: Open (the first traded price), High (the peak), Low (the trough), and Close (the final price)—collectively known as OHLC data. Many datasets also include tick-by-tick records showing every individual price change, bid-ask spreads that reveal transaction costs, and volume approximations (though true centralized volume doesn't exist in decentralized forex markets).
Why does this matter? Patterns repeat. Market participants—algorithms, institutions, retail traders—respond to similar stimuli in predictable ways. A currency pair that consistently rallies during European morning sessions or weakens before major employment reports isn't coincidence; it's behavioral economics in action. Historical data lets you quantify these tendencies, test whether they're statistically significant, and build strategies around them.
Beyond pattern recognition, historical records provide the raw material for backtesting—simulating how a trading strategy would have performed using past price action. A strategy that looks brilliant on paper might have generated catastrophic drawdowns during the 2020 volatility spike or the 2015 Swiss franc de-pegging. You won't know until you run it against real historical conditions.
Quality historical data isn't just a nice-to-have for quantitative traders—it's the foundation of every robust strategy we deploy. Garbage data produces garbage results, and in live markets, that means real capital loss
— Michael Chen
The granularity you need depends on your approach. Swing traders analyzing weekly trends can work with daily OHLC bars. High-frequency scalpers require tick data capturing millisecond-level movements. Position traders studying multi-year currency cycles might look back two decades, while day traders often need just six months of minute-by-minute data to validate intraday patterns.
Where to Find Reliable Historical Exchange Rate Sources
Not all historical data sources deliver equal quality. Gaps, erroneous spikes, and misaligned timestamps plague low-quality datasets, skewing backtest results and leading to false confidence in flawed strategies.
Free sources include central banks like the Federal Reserve (FRED database), European Central Bank, and Bank of England, which publish daily reference rates for major pairs. These work well for long-term analysis but lack intraday granularity. Broker platforms such as MetaTrader 4/5 offer built-in history for account holders, though data quality varies by broker and often includes gaps during weekends or low-liquidity periods.
Paid providers specialize in clean, tick-level data with proper adjustments for splits, rollovers, and corporate actions. Vendors like Dukascopy, HistData, and TrueFX maintain extensive archives, often stretching back 15-20 years for major pairs. Institutional-grade sources such as Refinitiv (formerly Reuters) and Bloomberg Terminal provide the highest fidelity data, including depth-of-book information, but cost thousands annually.
When evaluating sources, scrutinize these criteria:
Completeness: Are there unexplained gaps? Missing data during the 2016 Brexit vote or 2020 pandemic volatility renders backtests unreliable for stress-testing.
Timestamp accuracy: Data should reflect the timezone and server time used by your trading platform. Misaligned timestamps distort entry and exit signals.
Spread representation: Does the data include realistic bid-ask spreads? Many free datasets use mid-prices, ignoring the transaction costs that erode real-world profitability.
Survivorship bias: Delisted or merged currency pairs shouldn't vanish from historical records without notation.
Provider
Data Types
Timeframes Available
Cost
Notable Features
Dukascopy
Tick, 1-min bars
2008–present
Free (with registration)
Swiss bank data, high reliability
HistData.com
Tick, M1 bars
2000–present (varies by pair)
Free & premium tiers
Easy CSV downloads, major pairs focus
TrueFX
Tick (bid/ask)
2009–present
Free
Actual spreads included, institutional feeds
Refinitiv Eikon
Tick, all timeframes
20+ years
~$3,600/year
Depth-of-book, news integration
MetaTrader History Center
M1–MN bars
10+ years (broker-dependent)
Free with account
Built-in platform integration
Kibot
Tick, 1-min bars
15+ years
From $49/month
Adjusted data, multiple asset classes
Norgate Data
Daily bars
30+ years
From $299/year
Focus on daily/weekly for position traders
Central bank data works for academic research or long-term trend analysis but falls short for strategy development requiring intraday precision. For serious backtesting, budget at least a few hundred dollars annually for quality tick or minute-level data covering your target pairs.
Understanding Data Types and Formats
Daily OHLC Data vs. Tick Data
Daily OHLC bars aggregate all price activity within a 24-hour period into four values. A EUR/USD daily bar might show: Open 1.0850, High 1.0920, Low 1.0830, Close 1.0900. This format suits position traders and swing traders who hold positions for days or weeks. Storage requirements are minimal—decades of daily data for all major pairs fit in a few megabytes.
Tick data records every single price change as it occurs. A single active trading day for EUR/USD might generate 50,000–100,000 tick records. Each entry typically includes timestamp, bid price, ask price, and sometimes volume. High-frequency traders and algorithm developers need this granularity to model slippage, test order execution logic, and capture intraday microstructure.
The trade-off: tick data files for one pair over five years can consume 50+ gigabytes. Processing this volume requires robust hardware and efficient code. Many traders compromise with 1-minute or 5-minute bars, which capture intraday dynamics while remaining computationally manageable.
Author: Vanessa Cole;
Source: martinskikulis.com
Bar Data and Timeframe Variations
Bar data compresses tick information into fixed intervals: 1-minute, 5-minute, 15-minute, hourly, 4-hour, daily, weekly, or monthly bars. Each bar still uses OHLC format but represents a shorter or longer period.
Choosing the right timeframe depends on your trading frequency. Scalpers working 1-5 minute charts need corresponding bar data. Day traders focus on 5-minute to 1-hour bars. Swing traders analyze 4-hour and daily charts. Position traders study weekly and monthly bars.
One subtle issue: bar construction methods vary. Some platforms build bars from the first tick after the hour; others use server time that might not match your timezone. A "daily" bar for EUR/USD might close at 5 PM EST (New York close) or midnight GMT depending on the provider. This inconsistency can shift support/resistance levels by several pips, enough to impact tight stop-loss strategies.
File formats also differ. CSV (comma-separated values) files are universal and human-readable but inefficient for large datasets. Binary formats like .hst (MetaTrader) or .tck (proprietary) load faster and consume less space. JSON and XML appear in API feeds but add parsing overhead. Most backtesting platforms accept CSV, so it's the safe choice for portability.
How to Use Historical FX Data for Backtesting Strategies
Backtesting simulates how a trading strategy would have performed using historical data, revealing potential profitability, drawdown risk, and behavioral quirks before risking real capital.
Step 1: Define your strategy with precision. Vague rules like "buy when momentum is strong" can't be backtested. Specify: "Enter long when 20-period EMA crosses above 50-period EMA, RSI is below 70, and price is above the daily pivot point. Exit when RSI exceeds 80 or price drops 50 pips below entry."
Step 2: Select your data range carefully. Include at least one full market cycle—bullish trends, bearish trends, and ranging periods. Testing only the 2020-2021 dollar weakness won't reveal how your strategy handles the 2022-2023 dollar rally. A common guideline: use 70% of your historical data for in-sample testing (developing the strategy) and reserve 30% for out-of-sample validation (confirming it works on unseen data).
Step 3: Import data into your backtesting platform. MetaTrader 4/5 users can import CSV files via the History Center, though MT4's Strategy Tester has known limitations with tick data accuracy. TradingView allows custom data imports for premium users. Dedicated backtesting software like QuantConnect, Backtrader (Python), or TradeStation offers more flexibility for complex strategies.
Step 4: Run the simulation with realistic assumptions. Include spreads, commissions, and slippage. A strategy that shows 300% returns without transaction costs might break even—or lose—once you deduct 2-pip spreads and $7 round-trip commissions per lot. Model slippage conservatively; assume market orders during high volatility execute 1-2 pips worse than the tested price.
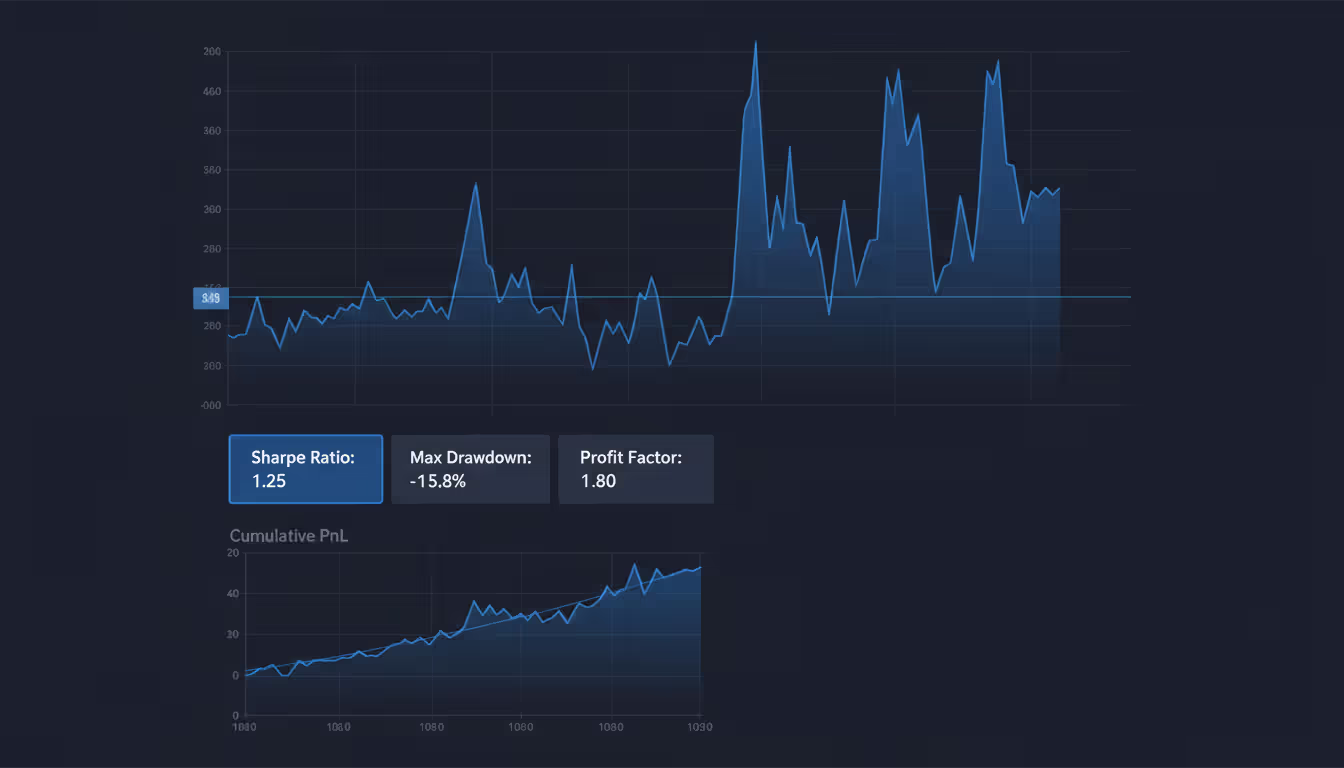
Step 5: Interpret results skeptically. A 60% win rate sounds impressive until you see the average loss is twice the average win. Focus on metrics like Sharpe ratio (risk-adjusted returns), maximum drawdown (worst peak-to-trough decline), and profit factor (gross profit divided by gross loss). A strategy with a 1.5+ Sharpe ratio and sub-20% maximum drawdown is worth further investigation.
Author: Vanessa Cole;
Source: martinskikulis.com
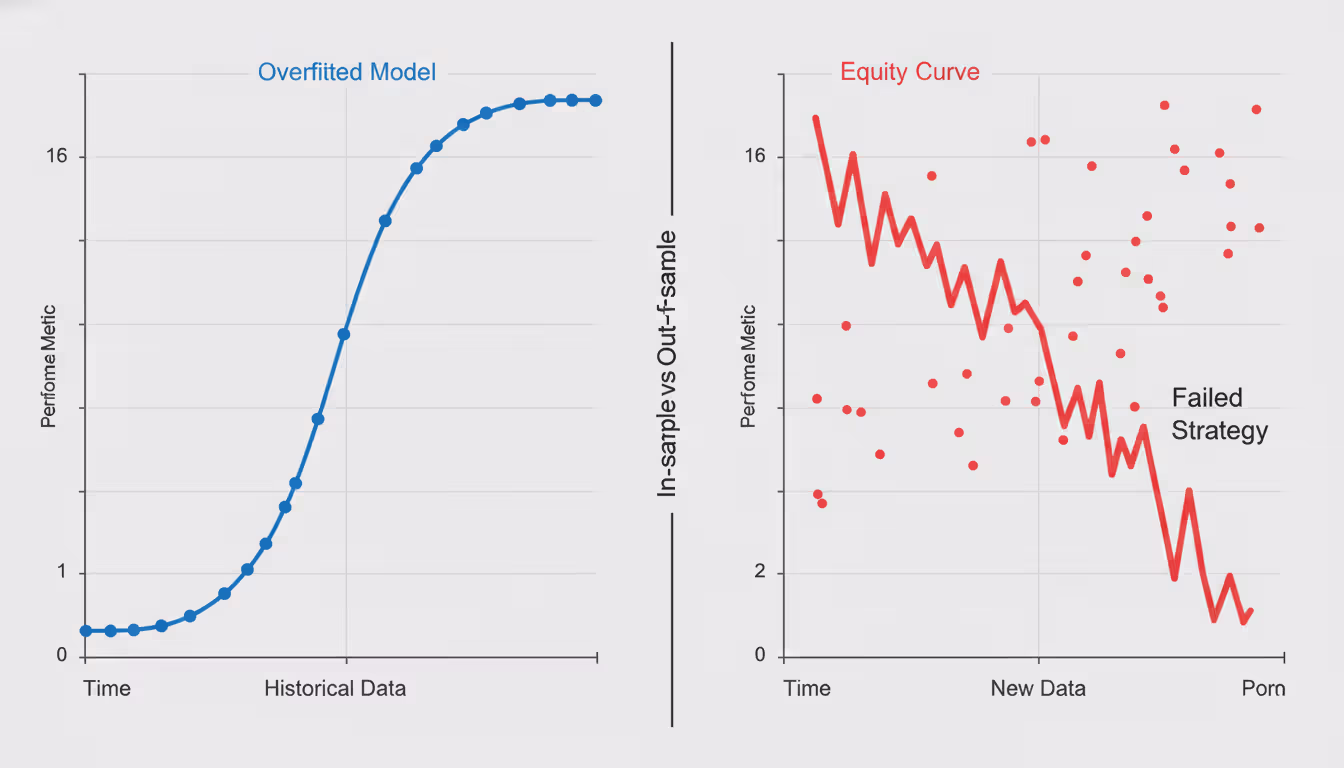
Common pitfall: overfitting. If you tweak parameters until your backtest shows perfect results, you've likely created a strategy that memorized past data but fails in live markets. Avoid excessive optimization. A robust strategy should work across multiple currency pairs and timeframes without radical parameter changes.
Analyzing Currency Pair Historical Charts for Patterns
Historical charts transform raw data into visual narratives, revealing how price behaved at key levels and during significant events.
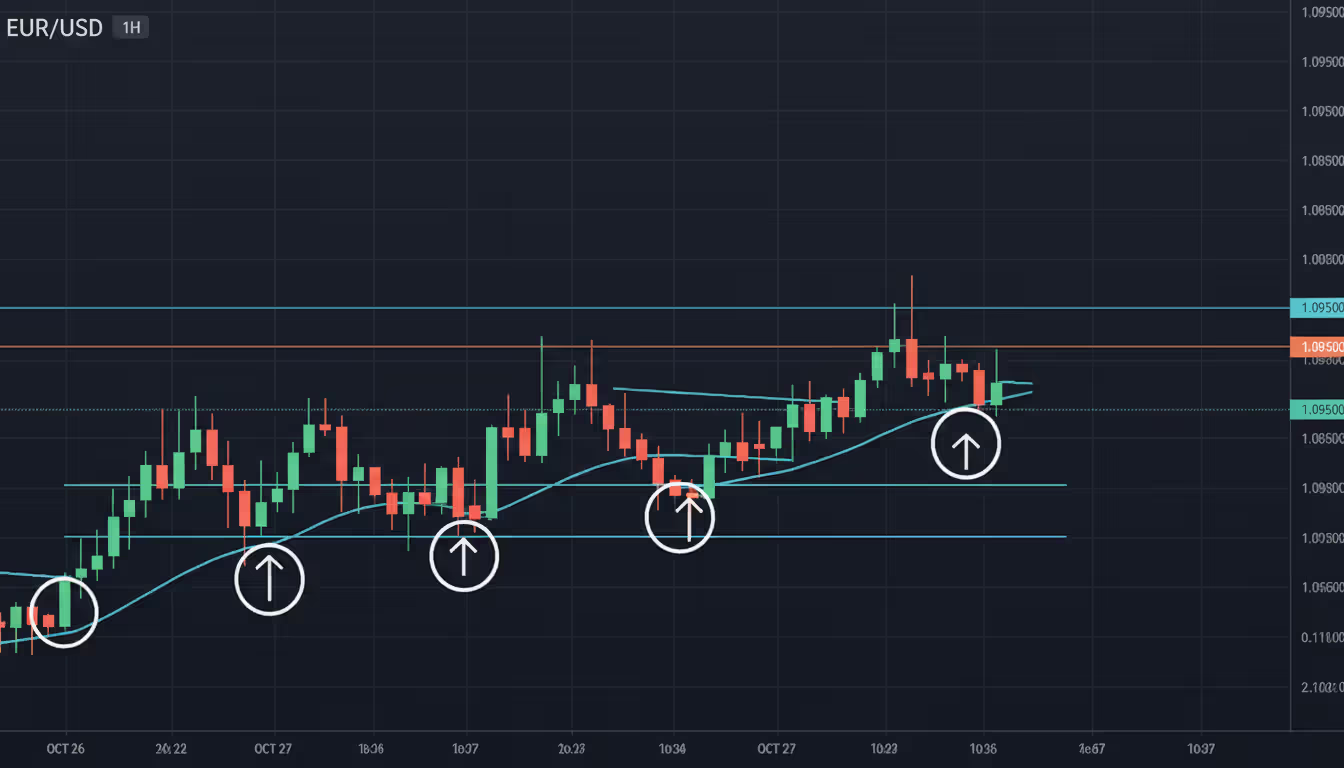
Start by identifying support and resistance zones—price levels where buying or selling pressure historically concentrated. If EUR/USD bounced off 1.0800 five times over three months before breaking lower, that level represented significant support. When price returned to 1.0800 from below, former support often becomes resistance—traders who bought at 1.0800 and held through the decline look to exit at breakeven.
Author: Vanessa Cole;
Source: martinskikulis.com
Seasonal patterns in historical FX data reflect predictable calendar-based behaviors. The Japanese yen often strengthens in March as Japanese corporations repatriate foreign earnings for fiscal year-end. The Australian dollar shows sensitivity to Chinese economic data releases, which cluster around mid-month. USD pairs experience heightened volatility during the first Friday of each month due to U.S. non-farm payroll reports.
To quantify seasonality, aggregate historical data by month, week, or day of week. Calculate average returns for EUR/USD every January over the past 15 years. If the pair rose 12 out of 15 Januaries with an average gain of 1.2%, that's a statistically interesting pattern—though not a guaranteed edge.
Chart patterns like head-and-shoulders, double tops, and ascending triangles appear frequently in historical data. Skeptics dismiss these as subjective, but they reflect genuine shifts in supply-demand dynamics. A double top at 1.1000 shows sellers twice overwhelmed buyers at that level, increasing the probability of a breakdown if price approaches 1.1000 a third time.
When analyzing multi-year charts, account for regime changes. The 2008 financial crisis, 2015 Swiss franc de-pegging, 2020 pandemic, and 2022 inflation surge all fundamentally altered currency relationships. A correlation that held for a decade can vanish overnight when central bank policy shifts. Historical data shows what happened; your job is determining which conditions remain relevant.
How Far Back Forex Data Goes and What You Actually Need
Major currency pairs like EUR/USD, GBP/USD, and USD/JPY have reliable electronic data stretching back to the late 1990s or early 2000s, depending on the provider. Some institutional sources offer reconstructed data to the 1970s, though liquidity and spread accuracy decline the further back you go.
Exotic pairs and emerging market currencies have shorter histories. USD/PLN (Polish zloty) might only have clean data from 2010 onward. Cryptocurrency-fiat pairs like BTC/USD have existed less than 15 years.
How much history do you actually need? It depends on your strategy's holding period and the market cycles you want to test:
Scalpers and day traders: Six months to two years of high-quality tick or minute data suffices. You're testing execution and intraday patterns, not multi-year trends.
Swing traders: Three to five years captures multiple trend cycles and at least one major volatility event.
Position traders: Ten to twenty years provides robust statistical samples, including the 2008 crisis, 2015 currency shocks, 2020 pandemic, and 2022-2023 inflation regime.
Machine learning models: More data isn't always better. Models can overfit to outdated regimes. Focus on recent, relevant periods unless you're specifically modeling regime-change detection.
A practical rule: your backtest should include at least 100 trades for statistical significance. If your strategy generates two signals per month, you need four years of data to reach 100 trades. Fewer trades mean results could be luck rather than edge.
Common Mistakes When Using Historical Data for Analysis
Survivorship bias occurs when your dataset excludes failed or delisted instruments. In equities, this is notorious—backtesting only stocks that survived inflates returns. Forex has less survivorship bias since currency pairs don't "go bankrupt," but brokers do delist illiquid pairs. If your data omits the 2015-2017 period when several brokers dropped exotic pairs, you miss critical stress-test scenarios.
Overfittinghappens when you optimize a strategy to perfection on historical data. You test 50 different moving average combinations and find that a 17/43 EMA crossover produced 400% returns. In live trading, it loses money because those specific parameters exploited random noise, not genuine edge. Combat overfitting by keeping strategies simple, limiting optimization variables, and always validating on out-of-sample data.
Author: Vanessa Cole;
Source: martinskikulis.com
Ignoring transaction costs is the fastest way to create a profitable backtest that bleeds money live. A scalping strategy that trades 20 times per day might show 15% annual returns—until you subtract 2-pip spreads and $7 commissions per trade. Suddenly you're down 8%. Always model realistic spreads (widen them during news events) and include all fees.
Using poor-quality data with gaps, spikes, or misaligned timestamps produces misleading results. A single erroneous tick showing EUR/USD at 0.9000 (a 10% flash crash that never happened) can trigger stop-losses in your backtest that would never occur in reality. Vet your data: plot it, check for anomalies, and compare multiple sources for major discrepancies.
Misinterpreting past performance as future guarantee is the classic mistake. Just because GBP/USD rallied every October for five consecutive years doesn't mean it will this year. Historical data reveals probabilities, not certainties. Markets evolve, correlations break, and black swan events defy historical precedent.
Neglecting regime changes leads to strategies optimized for conditions that no longer exist. A carry trade strategy that worked beautifully during the 2010-2019 low-volatility regime collapsed in 2020 when volatility spiked and correlations shifted. Segment your historical data by volatility regime, interest rate environment, and market structure to understand when your strategy thrives and when it struggles.
Frequently Asked Questions
Is forex historical data free or paid?
Both options exist. Free sources like central banks (Federal Reserve, ECB) and some brokers provide daily or basic intraday data suitable for educational purposes or long-term analysis. Paid providers offer higher quality: tick-level precision, verified timestamps, realistic spreads, and extensive history. Serious backtesting justifies spending $50-$500 annually on clean data; the cost is negligible compared to potential losses from strategies built on flawed free data.
What's the difference between tick data and bar data?
Tick data records every individual price change—potentially thousands per minute during active trading. Bar data aggregates ticks into fixed time intervals (1-minute, hourly, daily) showing open, high, low, and close for that period. Tick data enables precise modeling of order execution and slippage but requires significant storage and processing power. Bar data is more manageable and sufficient for most retail traders unless you're developing high-frequency strategies.
How much historical data do I need for backtesting?
Aim for at least 100 completed trades in your backtest for statistical relevance. If your strategy averages five trades per month, you need 20 months of data minimum. Additionally, include at least one full market cycle—trending and ranging periods—and one major volatility event (pandemic crash, central bank surprise). Day traders might need only 6-12 months; position traders should test across 5-10 years to capture diverse conditions.
Can I use broker data for accurate backtesting?
Broker-provided data through platforms like MetaTrader works for preliminary testing but has limitations. Data quality varies by broker; some have gaps, others show unrealistic spreads during off-hours. Broker data typically reflects their specific liquidity providers, which may differ from live market conditions. For final strategy validation before live trading, cross-reference broker data against a reputable paid source or use institutional-grade datasets.
Are there legal restrictions on using historical forex data?
Most historical forex data is freely usable for personal trading and analysis. However, redistributing proprietary datasets from paid providers violates licensing agreements. If you subscribe to a service like Refinitiv or Bloomberg, you can't legally share that data with others. Data from central banks and some free sources comes with open licenses. Always review the terms of service; commercial use (selling strategies or signals based on the data) may require additional licensing.
What file formats are most common for forex data?
CSV (comma-separated values) is the universal standard—human-readable, compatible with Excel, Python, R, and most backtesting platforms. MetaTrader uses .hst and .fxt binary formats for faster loading. Some providers offer JSON or XML for API integration. Tick data often comes compressed (.zip or .gz) due to file size. For maximum flexibility, request CSV; you can always convert to proprietary formats later. Ensure the CSV includes clear column headers: timestamp, open, high, low, close, and volume (if applicable).
Forex historical data transforms guesswork into evidence-based trading. By understanding data types—from daily OHLC bars to tick-level precision—you can match the right format to your strategy's needs. Reliable sources exist across the spectrum from free central bank feeds to institutional-grade paid providers; the key is evaluating quality through completeness, timestamp accuracy, and realistic spread representation.
Backtesting with historical data reveals whether your strategy would have survived past volatility spikes, trending markets, and ranging doldrums. But data alone isn't enough—you must avoid overfitting, account for transaction costs, and recognize that market regimes change. Historical patterns offer probabilities, not prophecies.
Whether you're analyzing seasonal tendencies in currency pair charts or stress-testing a quantitative model against two decades of price action, the discipline lies in skeptical interpretation. Test rigorously, validate out-of-sample, and remember that the best historical data in the world can't predict black swans. It can, however, prepare you to recognize when market behavior deviates from historical norms—often the most valuable signal of all.
The pound to dollar exchange rate reflects economic health, central bank policy, and political stability. This guide explains what drives Cable, historical context, purchasing power parity, seasonal patterns, and expert forecasts for 2026 to help Americans make informed currency decisions
Non-Farm Payroll releases create dramatic currency market swings on the first Friday of most months. Learn what NFP means for forex traders, how employment data drives USD volatility, and proven strategies for trading this high-impact economic event safely and profitably
The British pound has traded within 1.2450-1.2850 against the dollar through early 2026, reflecting balanced fundamentals. Interest rate differentials, inflation dynamics, and Brexit's lasting impact shape the pair's outlook, with major banks forecasting modest weakness toward 1.2400 over 12 months
Forex volatility describes the rate and magnitude of price changes in currency pairs. This guide covers measurement methods like ATR and historical volatility, explores factors driving volatility including news events and VIX correlation, and provides practical strategies for trading both high and low volatility conditions
The content on this website is provided for general informational and educational purposes only. It is intended to explain concepts related to Forex (FX) trading, currency markets, leverage, hedging, and risk management.
All information on this website, including articles, guides, and examples, is presented for general educational purposes. Forex trading carries significant risk, and outcomes may vary depending on market conditions, leverage, and individual decisions.
This website does not provide financial, investment, or trading advice, and the information presented should not be used as a substitute for consultation with qualified financial professionals.
The website and its authors are not responsible for any errors or omissions, or for any outcomes resulting from decisions made based on the information provided on this website.