Market sentiment acts as the invisible hand guiding currency prices, often before fundamentals catch up. Understanding what traders collectively believe about a currency pair—and whether they're positioning long or short—gives you an edge that charts alone cannot provide. This guide breaks down how to read, measure, and trade forex sentiment using real data sources available to retail and institutional traders alike.
What Is Forex Market Sentiment
Forex market sentiment represents the aggregate mood and positioning of all participants in the currency market at any given moment. When the majority of traders expect the euro to strengthen against the dollar, bullish sentiment dominates EUR/USD. Conversely, bearish sentiment reflects expectations of decline.
This collective psychology doesn't exist in a vacuum. It stems from economic data releases, central bank policy shifts, geopolitical events, and technical chart patterns that traders interpret. When enough market participants act on similar beliefs—buying or selling a currency pair—their combined orders create price movement that can reinforce or reverse the initial sentiment.
Bullish sentiment means traders anticipate upward price movement. They hold net long positions, expecting to profit as the exchange rate rises. Bearish sentiment signals the opposite: net short positioning with expectations of falling prices. The intensity of sentiment matters as much as its direction. Mild bullish sentiment might produce gradual gains, while extreme bullish positioning often precedes sharp reversals when the crowd realizes they're all leaning the same direction.
Trader psychology plays a central role because humans exhibit predictable biases. Fear of missing out drives herding behavior during trends. Panic selling amplifies declines. Overconfidence at market extremes sets up contrarian opportunities. Large institutional players understand these patterns and monitor retail positioning to identify when the crowd might be wrong.
Collective positioning affects currency pairs through order flow. When 80% of retail traders hold long positions on GBP/USD, that creates a potential supply of sell orders if the market turns against them. Stop-loss clusters form at predictable levels, and when price triggers those stops, the resulting cascade can accelerate moves. Smart money watches for these imbalances.
How Sentiment Drives Price Movement in Currency Markets
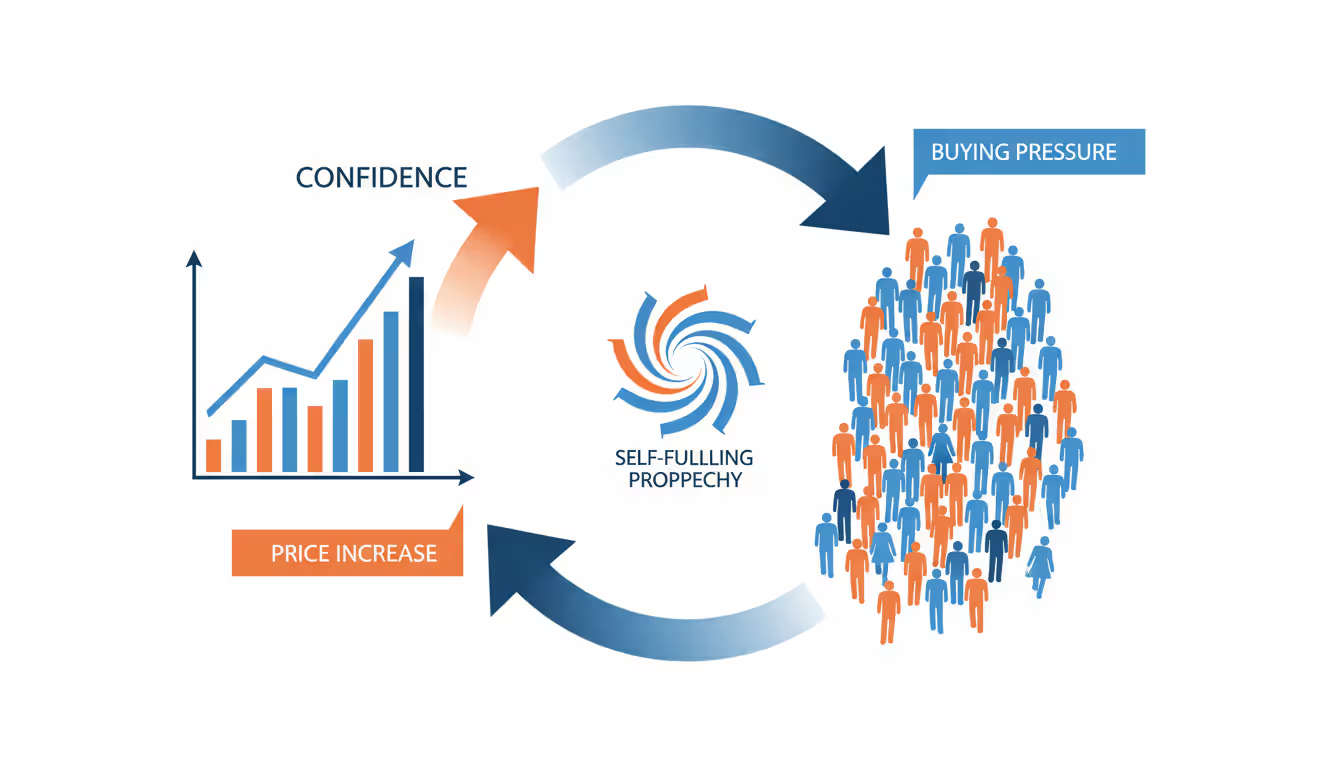
Sentiment and price action maintain a complex feedback loop. Initial sentiment—perhaps sparked by a central bank announcement—creates buying or selling pressure. As prices move, the movement itself attracts more participants who interpret the trend as confirmation. This self-reinforcing cycle explains why currency pairs often overshoot fundamental valuations.
Self-fulfilling prophecies occur when widespread belief in a scenario makes it reality. If enough traders expect the Federal Reserve to maintain higher rates and position accordingly, the dollar strengthens not just from policy but from the positioning itself. The challenge lies in distinguishing sustainable sentiment-driven trends from temporary positioning squeezes.
Author: Olivia Kensington;
Source: martinskikulis.com
Momentum moves happen when sentiment and price align. A positive jobs report sparks bullish dollar sentiment, traders pile into long positions, and USD/JPY climbs 200 pips in a session. The sentiment confirms the fundamental catalyst, and technical breakouts attract additional momentum traders. These moves can persist for weeks when all three elements—fundamentals, sentiment, and technicals—point the same direction.
Reversals emerge when sentiment reaches extremes. Picture this: 95% of retail traders hold long EUR/USD positions after a three-week rally. Institutional players see this crowded trade and start selling. The first wave of retail stop-losses triggers at support levels, accelerating the decline. Panic spreads, and what began as profit-taking becomes a full reversal. Extreme sentiment often marks turning points precisely because everyone who wanted to buy already has.
The Swiss franc shock of early 2015 demonstrated sentiment's power. When the Swiss National Bank unexpectedly removed the EUR/CHF floor, years of accumulated short-franc positioning unwound in minutes. Traders who believed the peg was permanent faced catastrophic losses as sentiment whipsawed from complacency to panic. Price gapped 30% in some pairs—a stark reminder that consensus positioning creates vulnerability.
How to Measure Forex Sentiment
Measuring sentiment requires accessing data that reveals how traders are positioned. Three primary sources provide different windows into market psychology: government-reported positioning data, retail broker sentiment tools, and third-party aggregators.
Commitment of Traders Report and COT Data
The Commodity Futures Trading Commission publishes the Commitment of Traders report every Friday, showing positioning data from the previous Tuesday in futures markets. This report breaks down open interest into categories: commercial hedgers, large speculators (institutional traders and hedge funds), and small speculators (retail-sized accounts).
COT structure separates participants by their market role. Commercial hedgers—banks and corporations managing currency risk—typically position opposite to speculators. When commercials are net short euros while speculators are net long, it often signals a mature trend. Commercials tend to be right at extremes because they hedge actual business exposure rather than speculate on direction.
Reading positioning data requires understanding net long versus net short figures. If large speculators hold 80,000 long contracts and 30,000 short contracts in British pound futures, their net position is 50,000 long. Track changes week-over-week rather than absolute numbers. A shift from 50,000 net long to 20,000 net long indicates significant unwinding of bullish bets, even though bulls still outnumber bears.
The COT report lags by three days, which limits its use for day trading but provides valuable context for swing and position traders. Extreme readings—when speculator positioning reaches multi-year highs or lows—deserve attention. These extremes don't trigger immediate reversals, but they identify when the market is vulnerable to sentiment shifts.
Retail vs Institutional Sentiment Indicators
Retail traders and institutional players often position opposite each other, creating a contrarian signal. Retail sentiment tends to be wrong at major turning points because individual traders chase trends late and exit winners early. Institutional traders exploit these patterns by fading retail extremes.
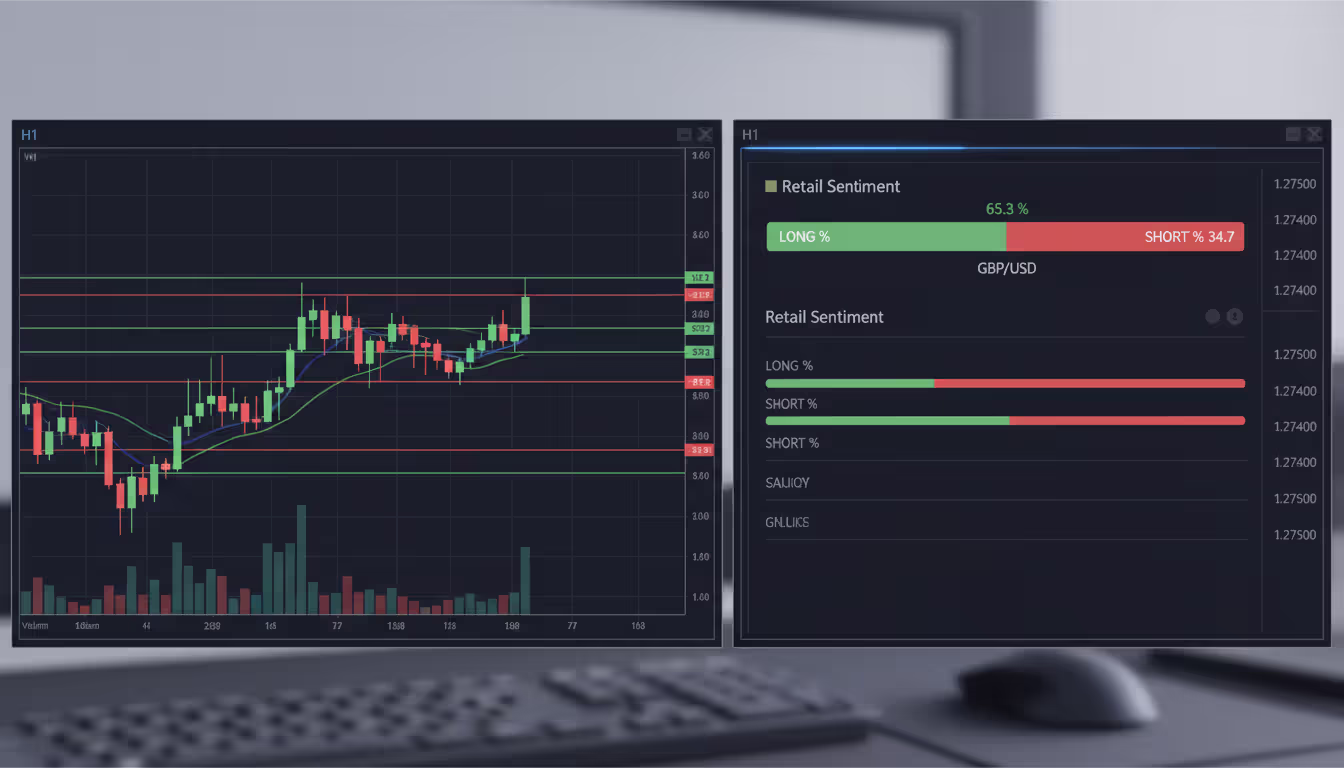
Broker sentiment tools display the percentage of client accounts holding long versus short positions on specific pairs. IG Client Sentiment, OANDA's Order Book, and Myfxbook Community Outlook publish this data freely. When 75% of retail accounts are long EUR/USD, contrarian traders interpret this as bearish because retail crowds typically mark tops and bottoms.
The difference between retail and institutional positioning creates trading opportunities. Retail traders might be 80% long on USD/CAD after a rally, while COT data shows large speculators reducing long positions. This divergence suggests smart money is distributing to the retail crowd—a classic topping pattern.
Retail sentiment updates in real-time or daily, offering more current information than the weekly COT report. However, retail data represents a smaller slice of total market activity. Institutions move larger size and drive price more directly, so their positioning carries more weight when the two conflict.
Sentiment Analysis Tools for Forex Traders
Several platforms aggregate and display sentiment data in trader-friendly formats. Myfxbook's Community Outlook shows positioning across thousands of connected accounts, offering a broad retail sentiment view. The interface displays long/short percentages and historical sentiment trends for major pairs.
DailyFX provides sentiment indicators alongside market analysis. Their sentiment page breaks down retail positioning by pair and includes a contrarian trading bias—when retail sentiment is extremely long, DailyFX suggests a bearish outlook. The tool updates daily and includes sentiment change indicators that highlight shifting crowd psychology.
TradingView integrates sentiment widgets into its charting platform. Traders can overlay sentiment data directly on price charts, making it easier to spot divergences between positioning and price action. The visual integration helps identify when sentiment extremes coincide with technical support or resistance levels.
Choosing the right tool depends on your trading style. Short-term traders benefit from real-time retail sentiment updates. Position traders gain more from weekly COT analysis combined with longer-term sentiment trends. Most successful traders monitor multiple sources to build a complete picture rather than relying on a single data point.
Using Sentiment Indicators in Your Trading Strategy
Sentiment data works best as a confirming factor rather than a standalone signal. Combine sentiment analysis with technical patterns and fundamental drivers to build higher-probability trade setups. When all three align—supportive fundamentals, bullish chart patterns, and positioning that isn't overcrowded—the odds improve significantly.
Integration starts with timeframe matching. If you swing trade on daily charts, weekly COT data and daily retail sentiment updates fit your horizon. Scalpers need intraday sentiment shifts, though these are harder to measure reliably. Avoid mixing short-term price decisions with long-term sentiment data; the mismatch creates false signals.
Author: Olivia Kensington;
Source: martinskikulis.com
Consider this scenario: GBP/USD tests a major support zone after a three-month decline. Technical analysis shows a potential double bottom. Fundamentals suggest the Bank of England might pause rate cuts. You check sentiment and find 85% of retail traders are short, while COT data shows speculators at their most bearish in a year. This extreme bearish positioning supports a contrarian long trade at support, with risk defined below the double bottom.
Combining multiple sentiment sources strengthens analysis. If retail sentiment shows extreme longs, COT data confirms large speculator crowding, and your broker's order book reveals stop-loss clusters just below current price, you've identified a vulnerable position. The trade setup becomes: fade the crowd, target the stop cluster, and manage risk if the trend continues.
Sentiment shifts often precede price reversals by days or weeks. Track changes in positioning rather than waiting for price confirmation. When large speculators begin reducing long positions while price still trends higher, it suggests distribution. The trend might continue short-term, but the sentiment shift warns of reduced upside potential.
Contrarian Forex Trading Based on Sentiment
Contrarian trading means positioning against the crowd when sentiment reaches extremes. The logic is simple: if 90% of traders are already long, who's left to buy? The remaining 10% can't push prices higher against the weight of potential sellers when the majority decides to take profits or cut losses.
Extreme positioning signals potential reversals, not immediate ones. Markets can remain irrational longer than traders can stay solvent, as the saying goes. A contrarian trade requires patience and strict risk management. Just because sentiment is extreme doesn't mean the trend will reverse tomorrow.
Identify extremes using historical context. Compare current positioning to the past two years. If EUR/USD retail sentiment reaches 80% long and the highest previous reading was 75%, you're at a statistical extreme. These levels don't guarantee reversals, but they increase the probability that the easy money has been made and smart money is preparing to fade the move.
Author: Olivia Kensington;
Source: martinskikulis.com
Entry timing matters enormously in contrarian trades. Wait for price confirmation—a reversal candlestick pattern, momentum divergence, or break of a trend line. Entering purely on extreme sentiment without price confirmation can lead to painful drawdowns as trends extend. The crowd can be wrong for weeks before price proves them wrong.
Real-world example: In late 2025, AUD/USD rallied sharply on commodity strength. Retail sentiment reached 88% long, the highest in three years. COT data showed large speculators at maximum long positioning. A contrarian trader waited for a bearish engulfing pattern at resistance before entering short. The trade worked because sentiment was extreme and price action confirmed the reversal. Had the trader shorted based solely on sentiment, they might have been stopped out before the reversal materialized.
Risks in contrarian trading include fighting strong trends and misjudging when extremes will matter. Not every crowded trade reverses immediately. Sometimes extreme bullish sentiment persists during powerful bull markets. Use position sizing that allows you to be early without suffering account damage. Consider scaling into contrarian positions as evidence accumulates rather than committing full size at the first sign of extreme sentiment.
Common Mistakes When Reading Market Sentiment
The key to trading success is emotional discipline. If intelligence were the key, there would be a lot more people making money trading. I know this will sound like a cliché, but the single most important reason that people lose money in the financial markets is that they don't cut their losses short
— Martin Schwartz
Overreliance on retail sentiment alone creates blind spots. Retail traders represent a fraction of total market volume. Institutional flow, central bank intervention, and algorithmic trading often overwhelm retail positioning. Use retail sentiment as one input, not the entire decision-making framework.
Ignoring fundamentals while focusing on sentiment leads to losses. Sentiment typically aligns with fundamental trends during strong directional moves. Fading bullish sentiment when fundamentals are genuinely positive means fighting both the trend and the underlying drivers. Sentiment works best at extremes when fundamentals have been fully priced in and positioning has become one-sided.
Misinterpreting COT data happens frequently among newer traders. A large net long position doesn't automatically mean a top is near. Strong trends often feature sustained one-sided positioning. What matters is the rate of change and whether positioning is reaching historical extremes. A move from 20,000 net long to 100,000 net long over eight weeks shows building momentum, not necessarily a reversal setup.
Timing issues plague sentiment-based trading. Extreme sentiment can persist for weeks before reversals occur. Traders who short a pair because sentiment is "too bullish" often face extended drawdowns. The solution: combine sentiment extremes with technical triggers that confirm price is actually turning. Don't anticipate reversals; wait for evidence.
Another mistake is treating all sentiment sources equally. A small broker's client sentiment might not represent the broader market. COT data from futures markets doesn't perfectly correlate with spot forex, though it's highly relevant. Weight your sources by their market representation and track record. Institutional positioning generally matters more than retail, though retail extremes can signal short-term turning points.
Finally, traders sometimes forget that sentiment is a lagging indicator of beliefs, not a leading indicator of outcomes. Just because everyone is bullish doesn't mean they're wrong—it might mean the trend is strong. Sentiment becomes most useful at extremes combined with other reversal signals, not as a standalone timing tool throughout a trend.
Comparison of Major Sentiment Data Sources
Source
Update Frequency
Best For
Cost
Pros
Cons
COT Report
Weekly (Friday)
Position traders, swing traders
Free
Official data, institutional positioning, historical depth
3-day lag, futures only, complex interpretation
Retail Broker Sentiment
Daily/Real-time
Contrarian setups, short-term trading
Free
Current, easy to read, contrarian signals
Limited market coverage, retail-only view
Positioning Data Providers
Varies by provider
Professional traders, multi-market analysis
Paid ($50-500/month)
Comprehensive, multiple markets, analytical tools
Cost, learning curve, information overload risk
Frequently Asked Questions
What does bullish sentiment mean in forex?
Bullish sentiment indicates that the majority of market participants expect a currency pair to rise. Traders hold more long positions than short positions, reflecting optimism about the base currency's strength relative to the quote currency. For example, bullish EUR/USD sentiment means traders anticipate the euro will strengthen against the dollar.
How often is the COT report released?
The Commodity Futures Trading Commission releases the Commitment of Traders report every Friday at 3:30 PM Eastern Time. The data reflects positioning as of the previous Tuesday's close, creating a three-day lag between the snapshot and publication. This weekly cadence makes COT data more suitable for swing and position trading than day trading.
Can I use sentiment indicators alone to trade forex?
No, sentiment indicators work best as confirmation tools within a broader strategy. Trading on sentiment alone ignores price action, fundamentals, and risk management principles. Successful traders combine sentiment analysis with technical patterns, economic data, and proper position sizing to build complete trade setups with defined risk-reward parameters.
What is the difference between retail and institutional sentiment?
Retail sentiment reflects positioning among individual traders and small accounts, typically accessed through broker client data. Institutional sentiment represents banks, hedge funds, and large speculators visible in COT reports. Retail traders often position incorrectly at extremes, while institutional players tend to be right at major turns, creating contrarian opportunities when the two diverge.
Is contrarian trading suitable for beginners?
Contrarian trading presents challenges for beginners because it requires fighting the prevailing trend and tolerating periods when the crowd appears right. New traders often lack the experience to distinguish between healthy trends and extreme positioning that warrants fading. Build foundational skills in trend following and risk management before attempting contrarian strategies based on sentiment extremes.
Where can I find free forex sentiment data?
Several sources offer free sentiment data: the CFTC publishes COT reports at cftc.gov, IG provides Client Sentiment on their website, Myfxbook displays Community Outlook positioning, and DailyFX offers sentiment indicators alongside analysis. TradingView includes sentiment widgets in its free charting platform. These tools give retail traders access to positioning data that was once available only to institutions.
Forex sentiment provides a window into market psychology that price charts and economic calendars cannot fully reveal. By measuring how traders are positioned—through COT reports, retail sentiment tools, and positioning data—you gain insight into potential turning points and trend strength. The most effective approach combines sentiment analysis with technical and fundamental factors, using extreme positioning as a warning flag rather than a standalone signal.
Contrarian opportunities emerge when the crowd leans heavily one direction and price action confirms a reversal. Yet sentiment also validates strong trends when positioning and fundamentals align. The skill lies in distinguishing between the two scenarios and managing risk when you're wrong. Track multiple sentiment sources, understand their limitations, and integrate this data into a complete trading framework. Sentiment won't tell you exactly when to enter or exit, but it will help you avoid joining the crowd at precisely the wrong moment—and that edge compounds over time into meaningful trading performance.
The pound to dollar exchange rate reflects economic health, central bank policy, and political stability. This guide explains what drives Cable, historical context, purchasing power parity, seasonal patterns, and expert forecasts for 2026 to help Americans make informed currency decisions
Non-Farm Payroll releases create dramatic currency market swings on the first Friday of most months. Learn what NFP means for forex traders, how employment data drives USD volatility, and proven strategies for trading this high-impact economic event safely and profitably
The British pound has traded within 1.2450-1.2850 against the dollar through early 2026, reflecting balanced fundamentals. Interest rate differentials, inflation dynamics, and Brexit's lasting impact shape the pair's outlook, with major banks forecasting modest weakness toward 1.2400 over 12 months
Forex volatility describes the rate and magnitude of price changes in currency pairs. This guide covers measurement methods like ATR and historical volatility, explores factors driving volatility including news events and VIX correlation, and provides practical strategies for trading both high and low volatility conditions
The content on this website is provided for general informational and educational purposes only. It is intended to explain concepts related to Forex (FX) trading, currency markets, leverage, hedging, and risk management.
All information on this website, including articles, guides, and examples, is presented for general educational purposes. Forex trading carries significant risk, and outcomes may vary depending on market conditions, leverage, and individual decisions.
This website does not provide financial, investment, or trading advice, and the information presented should not be used as a substitute for consultation with qualified financial professionals.
The website and its authors are not responsible for any errors or omissions, or for any outcomes resulting from decisions made based on the information provided on this website.