Professional forex trader sitting at a multi-monitor trading desk with candlestick charts and sentiment indicators on screens in a blue-lit modern office
Forex market sentiment represents the collective mood, bias, and positioning of traders toward a specific currency pair. While fundamental analysis examines economic data and technical analysis studies price patterns, sentiment analysis focuses on what traders are actually doing with their money—where they're placing their bets and how aggressively.
Price movements in currency markets don't always align with economic fundamentals. A country might release stellar GDP numbers, yet its currency falls. Why? Because traders had already positioned for that outcome, and the news was "priced in." Understanding sentiment helps you see what the crowd expects versus what might actually unfold.
Fear and greed in forex manifest in measurable ways. When greed dominates, traders pile into positions, leverage increases, and open interest swells. Fear triggers the opposite: rapid unwinding of positions, spiking volatility, and flight to safe-haven currencies like the Japanese yen or Swiss franc. These emotional extremes create predictable patterns in positioning data.
The psychology behind sentiment is straightforward. Most traders—especially retail participants—react to recent price action. They buy after rallies and sell after declines. This herd behavior creates exploitable imbalances. When 85% of retail traders hold long EUR/USD positions, that extreme consensus often signals an impending reversal rather than continued strength.
Market sentiment shifts don't happen in isolation. They interact with fundamental catalysts and technical levels. A currency pair might reach a technical resistance zone just as positioning data shows extreme bullishness. That confluence creates high-probability reversal setups that pure technical or fundamental traders might miss.
How to Gauge Forex Market Mood Using Key Indicators
Reading forex positioning data requires multiple sources because no single indicator captures the complete picture. The Commodity Futures Trading Commission's Commitment of Traders report, futures open interest, broker-published retail sentiment, and volatility measures each reveal different aspects of market psychology.
COT reports show how different trader categories—commercial hedgers, large speculators, and small speculators—position in currency futures. Futures open interest tracks the total number of outstanding contracts, indicating whether new money flows into or out of a position. Broker sentiment feeds display what percentage of their retail clients hold long versus short positions on major pairs.
Volatility indices, particularly those tracking implied volatility in currency options, reveal fear levels. When implied volatility spikes above historical volatility, option buyers are paying premiums for protection—a sign that anxiety is rising even if spot prices haven't moved dramatically yet.
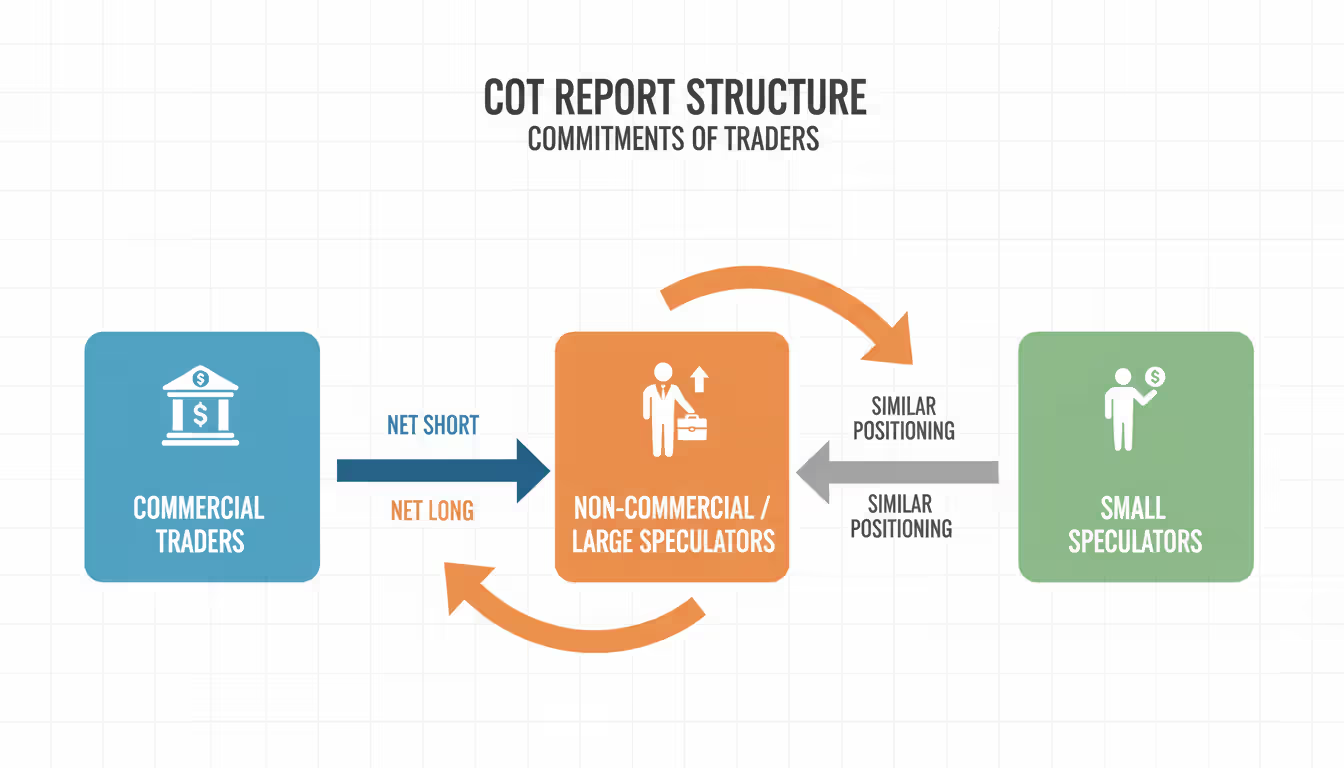
Understanding the Commitment of Traders (COT) Report
The COT report, published every Friday by the CFTC, breaks down positions held by traders in futures markets as of the previous Tuesday. This three-day lag means you're never looking at real-time data, but the patterns remain valuable for swing and position traders.
The report categorizes participants into commercial traders (banks, corporations hedging currency exposure) and non-commercial traders (hedge funds, CTAs, large speculators). A third category captures small speculators, though this group's positions are often too small to move markets meaningfully.
Author: Ethan Blackwell;
Source: martinskikulis.com
Commercial traders typically position opposite to price trends because they're hedging business operations, not speculating. When commercials hold record short positions in a currency, they're often right about long-term direction—but they can be early by weeks or months. Non-commercial traders show more directional conviction. Extreme net long or net short positions among this group often precede reversals, especially when combined with overbought or oversold technical conditions.
You can access COT data free through the CFTC website or via charting platforms that visualize the data. Look for the "Disaggregated" COT report for currencies, which separates producer/merchant/processor/user positions from swap dealers and managed money.
Open Interest in FX Futures Explained
Open interest counts every open futures contract—one buyer and one seller create one unit of open interest. Rising open interest alongside rising prices confirms that new money supports the trend. Traders are opening fresh long positions, not just closing shorts.
Falling open interest during a price rally suggests the move is driven by short-covering rather than new buying conviction. These rallies often lack staying power. Similarly, declining prices with falling open interest indicate longs are capitulating without aggressive new shorts entering—a sign the downtrend may be exhausting.
A sharp spike in open interest after a breakout validates the move. When EUR/USD breaks above a multi-month range and open interest jumps 15% in two weeks, institutional money is likely building positions for a sustained trend. Conversely, when open interest barely budges during a breakout, treat the move skeptically.
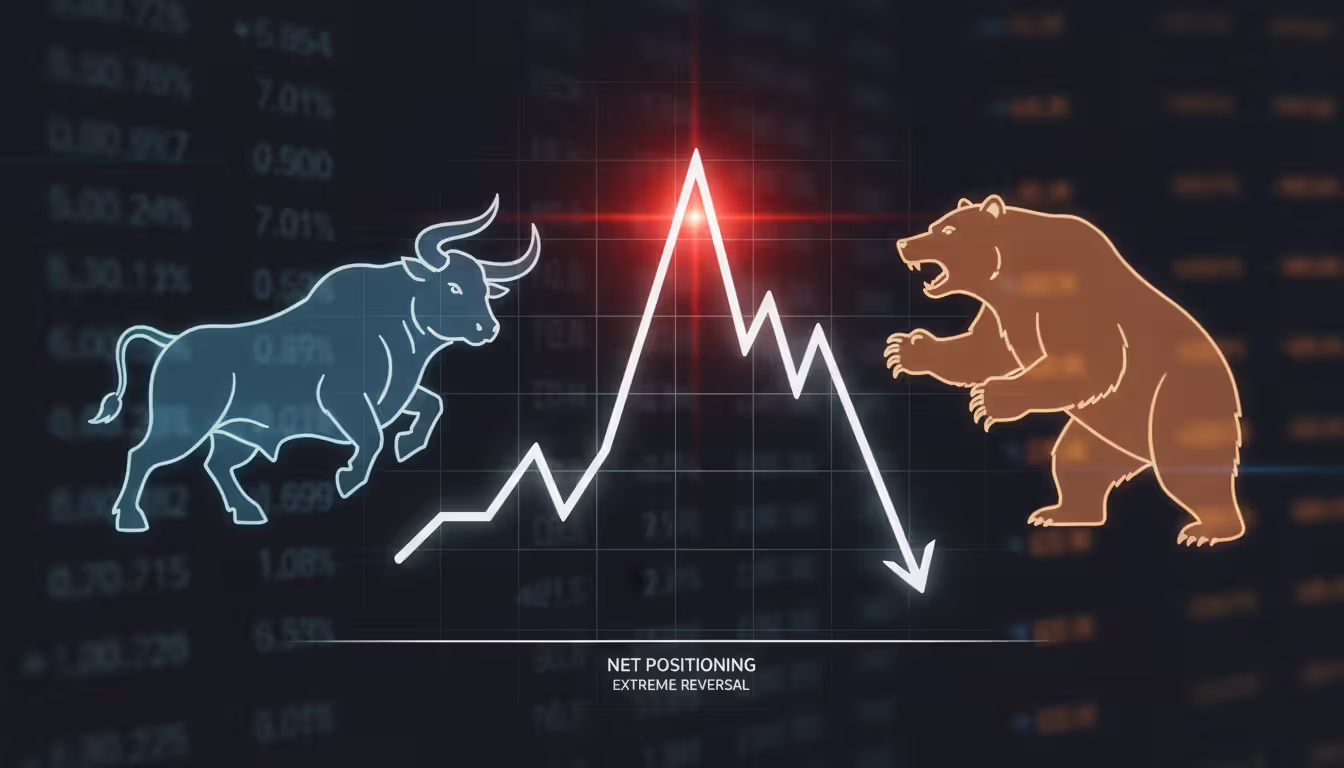
Net Long vs Net Short Positions: Reading the Data
Net positioning subtracts total short contracts from total long contracts for a specific trader category. A net long position of 50,000 contracts means that group holds 50,000 more longs than shorts. Extreme readings—positions in the top or bottom 10% of their five-year range—deserve attention.
When speculative positioning forex reaches historical extremes, the market becomes vulnerable to reversals. If hedge funds hold their largest net long British pound position in three years while GBP/USD stalls at resistance, that setup screams caution for bulls. The crowd has already bought; who's left to push prices higher?
Speculative positioning patterns before major moves often show slow, steady accumulation followed by a final surge. Smart money builds positions gradually over weeks. Then retail traders pile in during the final leg, creating the extreme reading that marks the top or bottom. By the time your neighbor mentions his forex account is up 20% on a single pair, the move is probably exhausted.
Author: Ethan Blackwell;
Source: martinskikulis.com
Net short positioning works identically in reverse. Record net shorts in the Australian dollar, combined with positive divergence in rate differentials or commodity prices, often precede sharp short-squeeze rallies. Traders positioned for further declines rush to cover when the currency refuses to make new lows.
Context matters enormously. A net long position of 40,000 contracts might be extreme for the Swiss franc but moderate for the euro, which trades in much higher volume. Always compare current positioning to its own historical range, not absolute numbers across different currencies.
How Institutional Traders Position in the Forex Market
Institutional traders—banks, hedge funds, pension funds, sovereign wealth funds—approach positioning differently than retail participants. They move size, which means they can't react to every price wiggle. Their entries and exits occur over days or weeks, creating footprints in positioning data.
Smart money indicators focus on commercial trader behavior in COT reports. While commercials hedge rather than speculate, their aggregate positioning reflects real-world currency needs from global trade and investment flows. When Japanese commercial traders aggressively short the yen, they're likely hedging export revenue or foreign investments—actions based on fundamental business needs, not chart patterns.
The lag between COT data release and actual positioning (three days) plus the lag between positioning and price response means you can't day-trade off this information. Institutions build positions anticipating moves weeks or months out. A hedge fund accumulating long EUR/USD positions in March might be positioning for a June rate decision.
Large speculators in the COT report—the non-commercial category—include CTAs (Commodity Trading Advisors) who often run trend-following algorithms. When this group flips from net short to net long, it signals that systematic trend models have turned bullish. These flips can precede multi-month directional moves because CTAs manage billions and add to positions as trends develop.
Institutional behavior also appears in order flow analysis and futures market depth, but those require specialized platforms. For most traders, COT data provides the most accessible window into how institutional traders position without needing a Bloomberg terminal.
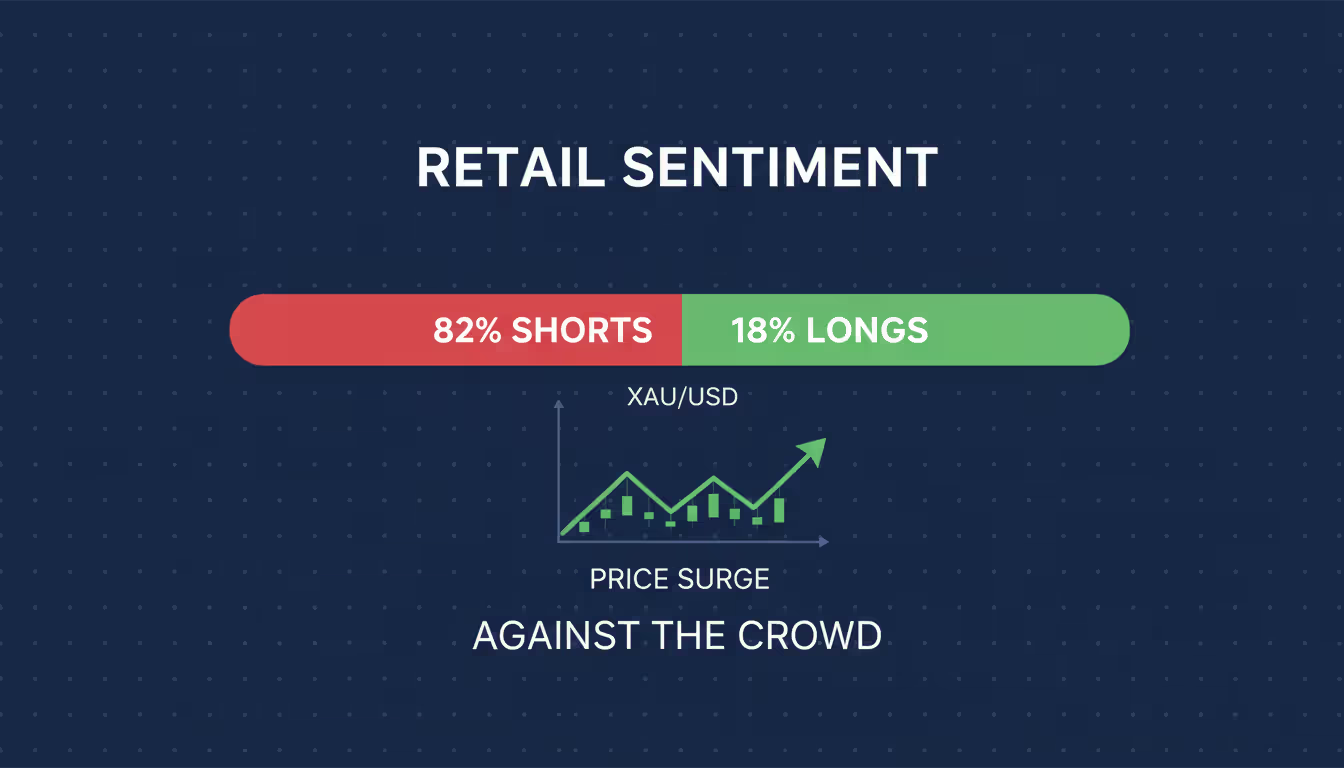
Retail Sentiment as a Contrarian Indicator
Major forex brokers publish what percentage of their clients hold long versus short positions on popular pairs. When 78% of retail accounts are long EUR/USD, contrarian traders view that as a bearish signal. The logic: retail traders consistently lose money, so doing the opposite of the crowd improves your odds.
Why retail traders are often wrong at extremes ties to emotional decision-making and poor timing. Retail participants chase momentum, entering long after a currency has already rallied substantially. They also hold losing positions too long, hoping for reversals, while cutting winners quickly. These behavioral patterns create predictable imbalances.
A practical example: In early 2025, retail sentiment on USD/JPY showed 82% of traders were short, betting on yen strength. The pair subsequently rallied 400 pips over three weeks as those shorts were forced to cover. The extreme bearish retail sentiment marked the bottom, not the beginning of a downtrend.
Fading retail sentiment works best at extremes—readings above 75% long or short. Moderate imbalances (55-65%) don't carry the same predictive power. You also need confirmation from price action or other sentiment indicators. If retail is 80% long but the currency is making higher highs with expanding volume, the trend might have further to run despite the lopsided positioning.
Limitations exist. Retail sentiment data from one broker might not represent the entire market. A broker catering to aggressive scalpers will show different patterns than one serving conservative swing traders. Some brokers also have conflicts of interest, potentially publishing data that encourages traders to take the wrong side of trades.
Use retail sentiment as one input, not a standalone system. Combine it with COT data showing institutional positioning, technical levels, and fundamental catalysts for the highest-probability setups.
Author: Ethan Blackwell;
Source: martinskikulis.com
Recognizing Market Sentiment Shifts Before They Happen
Market sentiment shifts often give advance warning through divergences and unusual patterns in positioning data. When price makes new highs but open interest declines, fewer traders believe in the move. When volatility compresses to multi-month lows while net positioning reaches extremes, a violent reversal often follows.
Sudden changes in open interest deserve immediate attention. If EUR/USD open interest drops 20% in one week without a major price move, large players are exiting positions. They might know something the market hasn't priced in yet—a central bank policy shift, geopolitical development, or shift in rate expectations.
Volatility spikes frequently precede sentiment reversals. When the VIX (while equity-focused, it correlates with general risk appetite affecting currencies) jumps 30% in two days, risk-off flows typically strengthen the yen and Swiss franc while hammering commodity currencies. Tracking implied volatility in currency options provides similar signals specific to forex markets.
Combining sentiment with technical and fundamental analysis creates the most robust framework. Imagine the British pound approaches a major resistance level tested three times over six months. COT data shows record net long positioning among speculators. Retail sentiment reads 81% long. The Bank of England just raised rates, meeting expectations but not exceeding them. That confluence—technical resistance, extreme bullish positioning, and a "sell the news" fundamental setup—creates a high-probability short opportunity.
Price-sentiment divergence works both ways. If a currency falls to new lows but retail traders remain stubbornly bullish (refusing to capitulate), the decline likely has further to go. True bottoms form when even the bulls give up, creating that final flush of selling before reversal.
Common Mistakes When Trading Forex Market Sentiment
The key to trading success is emotional discipline. If intelligence were the key, there would be a lot more people making money trading
— Victor Sperandeo
Over-relying on one indicator creates blind spots. Traders who only watch COT reports miss real-time shifts in retail sentiment or volatility. Those who only fade retail positioning might fight a genuine trend supported by fundamentals and institutional flows. Layer multiple sentiment measures for confirmation.
Ignoring timeframes causes confusion. COT data suits swing and position traders holding for weeks or months. Using it to time day trades guarantees frustration because the three-day lag and institutional timeframes don't align with intraday price action. Match your sentiment tools to your trading horizon.
Misinterpreting COT data happens when traders don't understand the categories. Commercial traders hedge, so their positioning doesn't predict short-term price moves—it reflects business needs. Treating commercial net shorts as a bearish signal misses the point. Focus on non-commercial (large speculators) for directional bias.
Timing errors plague sentiment traders. Extreme positioning can persist for weeks before reversals occur. Just because speculators hold record net longs doesn't mean the currency peaks tomorrow. You still need a trigger—a technical breakdown, fundamental surprise, or shift in related markets. Sentiment analysis identifies vulnerable setups; it doesn't time entries precisely.
Not accounting for market context leads to poor decisions. Record net short positioning in the Mexican peso might reflect genuine concerns about political instability or trade policy rather than an oversold condition ready to reverse. Always ask why positioning reached extremes before assuming mean reversion will occur.
Another mistake: assuming retail sentiment data from your broker represents the entire market. If your broker's clients are 85% long but institutional flows and futures positioning show balance, the retail extreme might be an isolated phenomenon with limited predictive value.
Institutional vs. Retail Positioning Characteristics
VIX measures equity volatility; indirect correlation to forex
FAQ
What is the best indicator for forex market sentiment?
No single indicator captures complete market sentiment. The COT report provides the most comprehensive view of institutional positioning but updates only weekly with a three-day lag. For shorter timeframes, combine broker retail sentiment data with futures open interest and volatility measures. The "best" indicator depends on your trading timeframe—position traders prioritize COT data, while swing traders might weight broker sentiment and open interest changes more heavily.
How often should I check the COT report?
Once weekly is sufficient for most traders since the report updates every Friday. Checking more frequently wastes time because the data doesn't change. Review the report over weekends when markets are closed, looking for significant shifts in net positioning or divergences between price and positioning. If you hold positions for months, checking every two weeks might suffice. Day traders shouldn't use COT data at all due to the lag and long-term nature of the information.
Can retail sentiment data be trusted?
Retail sentiment data is reliable as a contrarian indicator at extremes, but verify it represents a broad sample. Data from a broker with 50,000 active accounts carries more weight than one with 5,000. Also consider the broker's client profile—platforms attracting experienced traders show different patterns than those marketing to beginners. Never use retail sentiment from a single broker as your only decision factor. Cross-reference it with COT data and price action for confirmation.
What does extreme net long positioning mean for price?
Extreme net long positioning—when a trader category holds positions in the top 5-10% of their historical range—often precedes price reversals or consolidation. It signals the crowd has already bought, leaving fewer participants to push prices higher. However, extreme positioning can persist for weeks during strong trends. Look for additional triggers like technical resistance, fundamental disappointments, or shifts in related markets before assuming an immediate reversal. Extreme positioning creates vulnerability; it doesn't guarantee timing.
How do institutions hide their true positioning?
Institutions spread positions across multiple instruments and venues that don't appear in public data. They might hold spot forex positions (not reported in COT), currency options, and futures simultaneously. Large players also use prime brokers and dark pools where trades don't impact public order books immediately. Some hedge funds deliberately create small public positions opposite their true bias to mislead other traders. This means COT and other public data show only partial pictures of institutional positioning—another reason to combine multiple indicators.
Is sentiment analysis enough to trade forex profitably?
Sentiment analysis alone is insufficient for consistent profitability. It identifies when markets are vulnerable to reversals or when trends have strong conviction, but it doesn't provide precise entry and exit timing. Combine sentiment with technical analysis (support/resistance, trend lines, momentum indicators) and fundamental awareness (central bank policy, economic data, geopolitical events). The most successful traders use sentiment to filter opportunities—avoiding trades when sentiment opposes them and sizing up when all factors align.
Understanding forex market sentiment transforms how you interpret price movements and position yourself in the market. While most traders focus exclusively on charts or economic calendars, sentiment analysis reveals what participants are actually doing with their capital—where the crowd leans, where institutions accumulate, and when emotional extremes create opportunity.
The tools discussed—COT reports, open interest, retail sentiment feeds, and volatility measures—each provide unique perspectives on market psychology. COT data shows institutional and speculative positioning with a weekly cadence suited for swing and position traders. Open interest confirms whether trends have conviction or are driven by short-covering. Retail sentiment offers real-time contrarian signals at extremes. Volatility indices reveal fear levels before they fully manifest in price.
Success with sentiment analysis requires patience and context. Extreme positioning doesn't trigger immediate reversals; it creates vulnerability that needs a catalyst. The British pound might show record bullish positioning for three weeks before a central bank statement finally sparks the reversal. Your job is identifying the setup, then waiting for confirmation through price action or fundamental events.
Avoid common pitfalls: relying on single indicators, mismatching timeframes, misinterpreting commercial hedging as directional signals, and ignoring the broader market context. Sentiment analysis works best as a filter and confirmation tool within a complete trading system that includes technical levels and fundamental awareness.
The traders who profit from sentiment analysis think in probabilities, not certainties. They recognize that when 82% of retail accounts are long and COT data shows record speculative longs while price stalls at resistance, the odds favor reversal—but nothing is guaranteed. They size positions appropriately, use stops, and remain flexible when the market doesn't behave as expected.
Start incorporating sentiment analysis gradually. Track COT reports for your primary currency pairs over several months to understand normal ranges versus extremes. Monitor a reputable broker's retail sentiment feed and note how extreme readings (above 75% long or short) correlate with subsequent price action. Watch open interest during breakouts to see which moves have institutional support.
Over time, you'll develop intuition for when markets are dangerously one-sided versus healthily trending. That awareness—knowing when you're trading with the informed crowd or against the emotional herd—provides an edge that pure technical or fundamental analysis cannot deliver alone.
The pound to dollar exchange rate reflects economic health, central bank policy, and political stability. This guide explains what drives Cable, historical context, purchasing power parity, seasonal patterns, and expert forecasts for 2026 to help Americans make informed currency decisions
Non-Farm Payroll releases create dramatic currency market swings on the first Friday of most months. Learn what NFP means for forex traders, how employment data drives USD volatility, and proven strategies for trading this high-impact economic event safely and profitably
The British pound has traded within 1.2450-1.2850 against the dollar through early 2026, reflecting balanced fundamentals. Interest rate differentials, inflation dynamics, and Brexit's lasting impact shape the pair's outlook, with major banks forecasting modest weakness toward 1.2400 over 12 months
Forex volatility describes the rate and magnitude of price changes in currency pairs. This guide covers measurement methods like ATR and historical volatility, explores factors driving volatility including news events and VIX correlation, and provides practical strategies for trading both high and low volatility conditions
The content on this website is provided for general informational and educational purposes only. It is intended to explain concepts related to Forex (FX) trading, currency markets, leverage, hedging, and risk management.
All information on this website, including articles, guides, and examples, is presented for general educational purposes. Forex trading carries significant risk, and outcomes may vary depending on market conditions, leverage, and individual decisions.
This website does not provide financial, investment, or trading advice, and the information presented should not be used as a substitute for consultation with qualified financial professionals.
The website and its authors are not responsible for any errors or omissions, or for any outcomes resulting from decisions made based on the information provided on this website.