Your account hits $50,000. Three weeks later? It's sitting at $40,000. That $10,000 drop—that's drawdown in action.
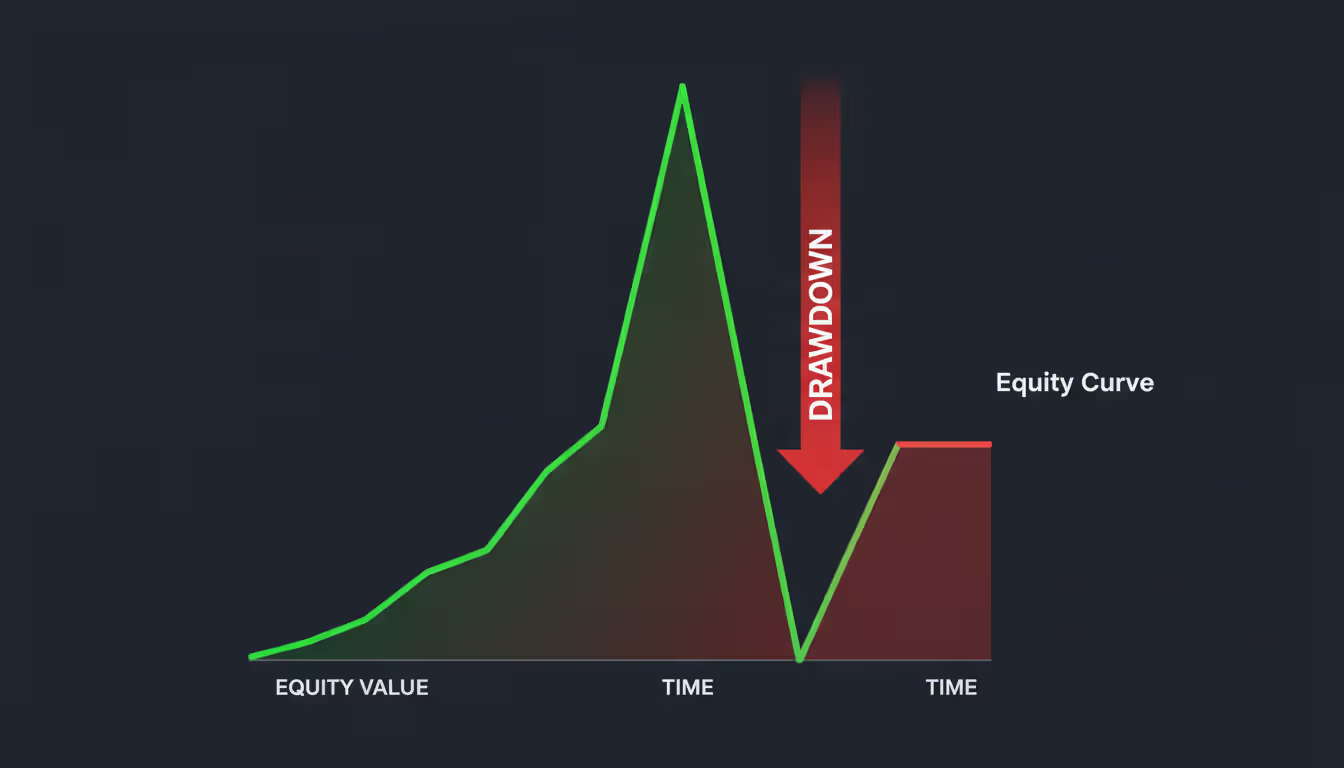
Here's what drawdown definition actually means: it tracks how far your account balance falls from its highest point until it bottoms out and starts climbing again. Picture your equity curve as a mountain range. Drawdown measures the vertical distance from a summit down to the valley below, stopping only when you've scaled back to a new peak.
Most traders get confused about what is a drawdown in trading because they mix it up with individual trade losses. They're related, sure, but not identical. Your equity curve tells the real story—that continuous line showing your account value over weeks or months. Every time that line dips below its previous high and stays there? You're experiencing drawdown. It doesn't stop measuring until you've pushed your account to fresh highs.
The peak to trough drawdown works like this: spot your account's absolute highest value (that's your peak), then track how far south it goes (the trough) before recovering. Account peaked at $75,000, bottomed at $60,000? You just lived through a $15,000 drawdown, or 20% if we're talking percentages.
Now let's clear up drawdown vs loss because traders mess this up constantly. Close a trade for a $500 loss? That's just a loss. Watch your account slide from $40,000 to $35,000 across two weeks of trading? That's a 12.5% drawdown. See the difference? Losses happen trade-by-trade. Drawdowns capture the entire decline in your account's health over time—open positions, closed positions, everything combined.
Here's a clearer example: you take three losing trades totaling $1,200 in losses. Sounds straightforward. But if your account dropped from $30,000 to $27,500 during that same period, your actual drawdown is $2,500. Maybe you had some winning trades mixed in that didn't fully recover the earlier losses. Maybe you're holding open positions that are underwater. Drawdown captures all of it.
How to Calculate Drawdown
Let's get mathematical without getting boring. You need three numbers: peak account value, lowest point (trough), and where you are now.
Real example time. Your account starts the year at $25,000. You hit a hot streak—by March, you're sitting at $32,000. That becomes your peak value. Then the market gets choppy. Your strategies stop working. By May, you've slid to $28,000 where things stabilize.
Author: Vanessa Cole;
Source: martinskikulis.com
Run the numbers: [($32,000 - $28,000) / $32,000] × 100 = 12.5%
Want the dollar figure? Simple subtraction: $32,000 - $28,000 = $4,000
Both numbers matter, but they tell different stories. Percentage drawdown lets you compare performance across accounts of any size—a $4,000 drop means something completely different to a $200,000 account versus a $10,000 account. Dollar drawdown shows you the actual capital at stake, which hits differently when you're looking at real money.
Maximum Drawdown Explained
Maximum drawdown explained: it's the ugliest number in your trading history. Take any time period—say, the last three years—and find the worst peak-to-trough decline you experienced. That's your max drawdown.
Why does this number matter so much? A trading system might show you 18% average yearly returns. Sounds attractive until someone shows you it suffered a 55% maximum drawdown in 2022. Would you really keep trading a system after watching it slice your account in half? Most people wouldn't, even if the math says they should.
Professional money managers obsess over maximum drawdown because it reveals your strategy's worst day. It answers: "When everything went wrong, how bad did it get?" That's your stress test. That's what tells you whether you can actually stick with this strategy when markets turn ugly.
Smart traders evaluate strategies by comparing returns against max drawdown. Here's what I mean: Strategy A produces 22% annual returns with 12% max drawdown. Strategy B generates 28% annual returns but with 38% max drawdown. Which would you trade? Most professionals pick Strategy A every time. The risk-adjusted returns matter more than the raw return numbers.
Think about it practically. Can you actually sit through a 38% drawdown? Can your spouse? Can your risk manager? The honest answer for most people is no—they'll abandon ship somewhere around 25-30%, guaranteeing they miss the recovery.
Calculating Drawdown Recovery Time
Drawdown recovery time counts how many days, weeks, or months you spend climbing from the valley floor back to your previous peak. This metric messes with your head more than almost any other trading statistic.
The calculation is straightforward enough: start counting from the day your account hits bottom, stop counting when you've reached a new all-time high.
But here's the nasty part that trips everyone up: recovering from a 50% drawdown requires a 100% gain. The math is brutal. Got $100,000? Drop to $50,000? You need to double your money just to get back to even. Not make a profit—just stop being in the hole.
Recovery time depends on three things: how deep you fell, what your typical return rate looks like, and whether you keep trading the same strategy or change approaches midstream. Let's say you average 2% gains monthly and you're down 20%. You're looking at roughly 12 months to recover, assuming you maintain that 2% pace without interruption (which is harder than it sounds).
Most traders dramatically underestimate how long recovery takes. You're down 30% and averaging 3% monthly returns? Budget about 11 months to dig out. Down 40%? You're looking at 18 months or more. And that assumes you maintain consistent profitability while your confidence is shot and you're questioning everything about your approach.
Why Drawdown Matters for Risk Management
Drawdown directly feeds into drawdown and risk of ruin—basically, what are the odds you'll blow up your account entirely? Risk of ruin calculations mix your maximum drawdown with your win rate and position sizing to estimate your survival chances.
Trade with frequent 30-40% drawdowns and you're flirting with disaster. Keep drawdowns under 15% and you've got a fighting chance. The math of compounding becomes your enemy during recovery. Each additional percentage point of drawdown demands exponentially larger gains to bounce back.
But honestly? The psychological damage often exceeds the financial hit. Watch 25% of your capital evaporate and see how clearly you think afterward. Traders in serious drawdowns make two classic mistakes: they bail on profitable strategies too early out of fear, or they go reckless trying to recover losses quickly.
Prop firms and institutional investors evaluate trading systems mainly through drawdown metrics. Show them 50% annual returns and they'll get interested. Show them 50% annual returns with 30% max drawdown and they'll show you the door. Why? Because real trading involves periods where nothing works, and deep drawdowns create actual operational problems—investors pull capital, brokers issue margin calls, traders have mental breakdowns.
Acceptable drawdown levels shift based on how you trade and what you're trading:
Trading Style
Typical Max Drawdown
Recovery Expectation
Risk Tolerance Level
Day Trading
5-15%
2-6 weeks
Low—you need capital available every morning
Swing Trading
10-20%
1-3 months
Moderate—positions run several days minimum
Position Trading
15-30%
3-12 months
Higher—catching long-term trends means riding volatility
Algorithmic Trading
10-25%
1-6 months
Depends entirely on strategy design and parameters
Professional traders typically refuse to run strategies showing historical max drawdowns above 25-30%. Retail traders? They often stomach bigger drawdowns, but this dramatically increases their risk of complete account destruction.
Account size changes the equation in unexpected ways. A 20% drawdown on a $5,000 account costs you $1,000—maybe manageable, but that might represent serious money if you're trading with limited resources. The same 20% on a $500,000 account ($100,000 loss) could end your professional career even though the percentage is identical.
Drawdown in Different Trading Markets
Author: Vanessa Cole;
Source: martinskikulis.com
Drawdown in forex trading hits differently because currency markets never sleep and leverage is readily available. Forex traders get sucker-punched by sharp, sudden drawdowns when pairs gap on central bank announcements or geopolitical shocks. You might be trading EUR/USD peacefully, then the European Central Bank drops an unexpected policy bomb overnight and boom—15% drawdown before you can react.
Forex drawdowns tend to be shorter but more violent than stock market equivalents. Currency pairs can snap back quickly, offering faster recovery opportunities. But that same volatility that saves you one week can destroy you the next.
Stock traders usually experience slower, more grinding drawdowns aligned with market cycles. When the S&P 500 drops into correction territory, most equity traders watch their accounts bleed. The upside? It's predictable. The downside? Diversifying across different stocks doesn't help much when the entire market tanks together.
Futures traders deal with drawdown patterns specific to their contracts. Agricultural futures might show seasonal drawdown patterns—soybeans act differently in spring than fall. Energy futures drawdowns often connect to weather events or Middle East tensions. Financial futures simply mirror underlying market sentiment.
Typical drawdown ranges vary by market type:
Forex: Discretionary traders see 10-25%, algorithmic systems often hit 15-30%
Stocks: Ranges from 15-35% depending whether you're day trading or holding long-term
Futures: 20-40% thanks to built-in leverage and volatility
Options: Premium sellers experience 25-50%, directional buyers often face 40-60%
Managing drawdown across multiple asset classes sounds smart in theory. Traders diversify into forex, stocks, and commodities thinking they've protected themselves. Then 2008 happens. Or March 2020. Suddenly everything correlates, everything falls together, and your "diversification" evaporates. True drawdown protection requires strategies with genuinely different return drivers, not just positions in different markets.
How to Manage and Reduce Drawdown
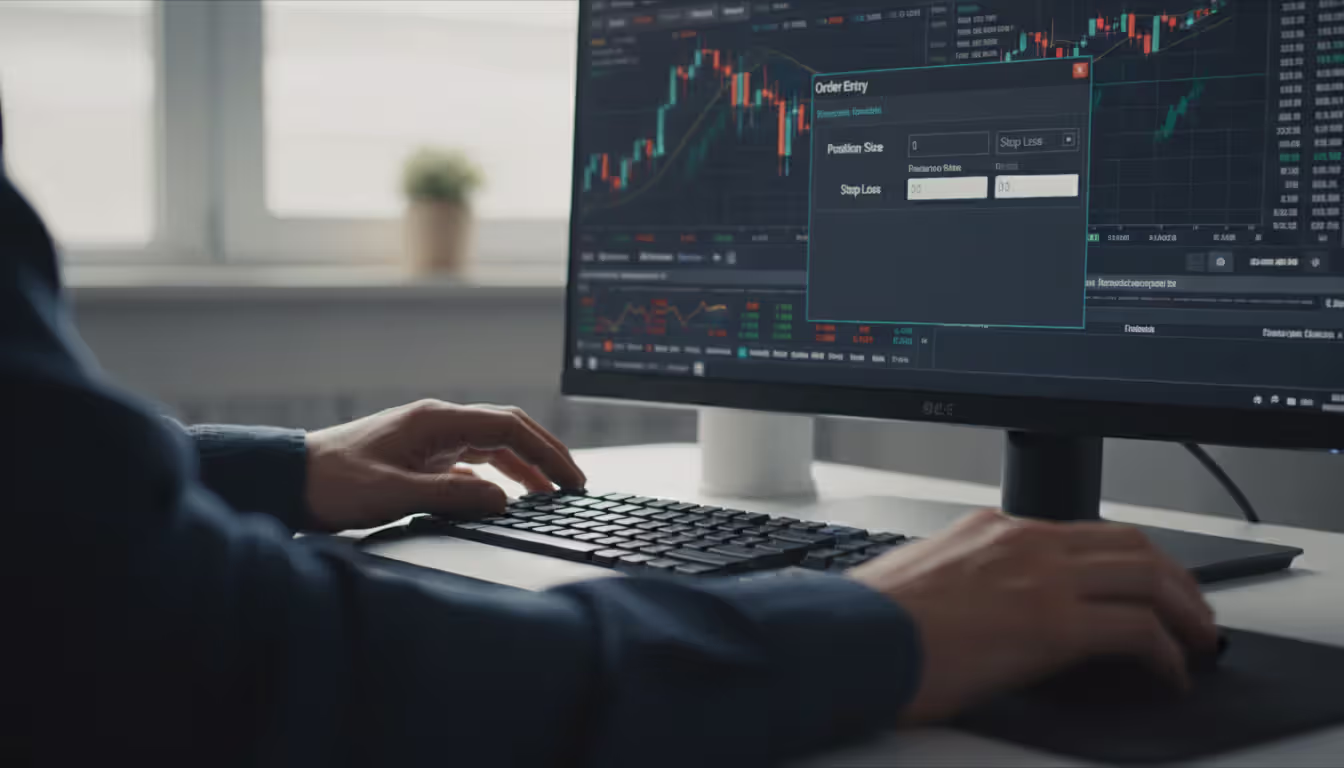
Managing drawdown in trading begins with position sizing—hands down your most powerful risk control tool. The standard rule? Risk 1-2% of your account per trade maximum. This single principle prevents any individual loss from creating meaningful drawdown.
Calculate your position size using this approach: take your account size, multiply by your risk percentage, then divide by the distance between your entry and stop loss. Got a $50,000 account, willing to risk 1% ($500), and your stop loss sits $2 away from entry? You can trade 250 shares maximum. Not 300. Not "roughly 250." Exactly 250 or fewer.
Stop-loss implementation separates traders who survive from those who don't. Every single position needs a predetermined exit point where you cut losses automatically. Traders who skip stop losses eventually experience account-destroying drawdowns. It's not if, it's when. The only question is whether you'll still have capital left when reality hits.
Author: Vanessa Cole;
Source: martinskikulis.com
Diversification works when you do it correctly. This doesn't mean trading ten currency pairs or twenty stocks that all follow the Nasdaq. Real diversification means combining uncorrelated strategies—maybe trend following during strong markets plus mean reversion for choppy conditions. Or mixing different timeframes where your day trades don't correlate with your swing positions.
When should you stop trading during drawdown? Controversial question. Some experts say take a break after hitting 15-20% drawdown. Makes sense—drawdowns often signal your strategy isn't matching current market conditions. Stepping aside prevents compounding losses while the market environment shifts.
Others argue stopping during drawdowns guarantees missing the recovery. If your strategy has genuine positive expectancy over time, continuing to trade (even with reduced size) keeps you positioned for the eventual turnaround.
I prefer a middle approach: cut position size by 50% after a 15% drawdown, reduce by 75% after 25% drawdown. This keeps you engaged and maintaining your skills without risking serious additional damage. Only return to full position sizing after you've recovered at least half the drawdown.
Recovery strategies should focus on consistency over home runs. Traders in drawdown feel desperate pressure to recover quickly. They start overtrading, increasing risk, looking for that one big winner to erase the pain. This approach typically creates deeper drawdowns. Instead, drop back to your smallest viable position size and rebuild confidence through consistent, boring execution.
Common Drawdown Mistakes Traders Make
Overleveraging during recovery kills more traders than any other mistake. You're down 20%. You feel behind. Pressure builds to recover fast. So you increase position sizes by 50%, figuring bigger trades will accelerate your climb back to breakeven. This rarely works.
The math explains why it fails: you're already wounded, down 20%, and now you're increasing risk by half? A normal losing streak becomes catastrophic. You're gambling with already-damaged capital, and the market hasn't suddenly become easier just because you're desperate.
Risk comes from not knowing what you're doing
— Warren Buffett
Ignoring maximum drawdown limits destroys careers. Traders develop strategies without defining acceptable drawdown thresholds beforehand. They keep trading through 30% drawdowns, then 40%, then 50%, believing the strategy will eventually recover. Sometimes they're right—but often they run out of capital before the recovery arrives.
Set your maximum drawdown limit before you start: "If I drop 25% from peak, I stop trading this strategy and reevaluate everything." Then actually honor that limit when you hit it. Emotional attachment to a losing strategy clouds your judgment when you're already down big.
Confusing drawdown with realized loss creates dangerous decision-making. Traders think, "I'm only down 18% on paper—it's not real until I close these positions." This mentality ignores reality. Your broker calculates margin requirements based on current account value, not what you hope it'll be eventually. Drawdown measures actual account value decline whether you've closed positions or not.
Abandoning strategies too early is the opposite problem. After a 10-15% drawdown, some traders panic and assume their strategy broke. They switch to something new. Repeat this pattern enough and you'll never let any strategy work through its normal variance. Every profitable approach experiences drawdowns—what matters is whether the current drawdown falls within historical norms.
Useful guideline: if your current drawdown is within 1.5× your historical maximum, you're likely experiencing normal variance. If it exceeds 2× your historical max, something fundamental has changed and you need to reassess seriously.
Frequently Asked Questions About Drawdown
What is considered an acceptable drawdown percentage?
Acceptable drawdown varies based on your trading style and personal risk tolerance, but most professionals keep maximum drawdown under 20-25%. Day traders should target 5-15% maximum since they need capital available every morning for new opportunities. Swing traders can handle 10-20% drawdowns because their positions run for days or weeks. Position traders following long-term trends might accept 15-30% since they're riding major market moves that involve volatility. Once you exceed 30% maximum drawdown, you're entering dangerous territory regardless of your strategy. Your personal threshold should be the point where you'd lose genuine confidence in your approach—and that's usually lower than you think when you're not actually experiencing the drawdown.
How long does it take to recover from a 50% drawdown?
Recovering from a 50% drawdown demands a 100% gain—you must double whatever capital remains. If you average 3% monthly gains, you're looking at roughly 24 months of perfect execution. Average 5% monthly? You'll need approximately 14 months. These calculations assume consistent profitability during recovery, which is wildly optimistic. Real-world recovery usually takes longer because traders struggle psychologically after major drawdowns, making mistakes that extend the recovery period. This is precisely why professional traders avoid 50% drawdowns entirely—the recovery timeline is too long and too uncertain. A trader maintaining 20% maximum drawdown only needs a 25% gain to recover, achievable in 6-8 months at moderate return rates.
Is drawdown the same as a trading loss?
No, they're different concepts. A trading loss represents a single closed position that ended negatively. Drawdown measures the cumulative decline in your total account value from peak to trough, regardless of how many individual trades contributed or whether positions are open or closed. You might take five losing trades totaling $2,000, but if your account dropped from $50,000 to $46,000 during that period, your drawdown is $4,000 or 8%. Maybe you had some winning trades that didn't fully offset earlier losses. Maybe you're holding open positions that are currently underwater. Drawdown captures the complete equity curve decline. Think of individual losses as single trees; drawdown is the entire forest.
What causes maximum drawdown in a trading account?
Maximum drawdown results from combining losing trades, inadequate risk management, and strategy misalignment with current market conditions. The most frequent cause is oversized positions—risking 5-10% per trade instead of the recommended 1-2%. Market regime changes also trigger serious drawdowns: trend-following strategies suffer badly during choppy, sideways markets. Overleveraging amplifies normal losing streaks into catastrophic drawdowns. Sometimes the cause is simpler and less dramatic: random variance. Even profitable strategies with proven positive expectancy experience losing streaks that create temporary drawdowns. What matters is whether your maximum drawdown falls within expected parameters based on historical testing and whether it exceeds your predetermined risk limits.
Should I stop trading during a drawdown period?
This depends on the drawdown's size and whether it falls within your strategy's historical performance range. For drawdowns under 15% that match your strategy's normal variance, continue trading but reduce position size by 25-50%. This keeps you engaged with markets while limiting additional damage. For drawdowns exceeding 20-25% or surpassing your historical maximum drawdown by 50% or more, take a trading break to reassess everything. Use the pause to review whether you're executing properly, check if market conditions have fundamentally shifted, and verify your strategy still has genuine edge. Never increase position size during drawdown trying to accelerate recovery—this almost always deepens the hole. Your goal during drawdown is surviving, not heroically conquering it through aggressive action.
How do professional traders limit drawdown?
Professional traders employ strict position sizing rules, never risking more than 1-2% of total capital on any single trade. They diversify across genuinely uncorrelated strategies rather than just different assets in the same market. Most importantly, they define maximum drawdown limits before trading begins and stop automatically when those limits are hit. Professionals reduce position size progressively as drawdown increases—trading at 50% normal size after a 15% drawdown, dropping to 25% size after 20%. They maintain detailed trading journals to diagnose whether drawdown stems from poor execution, fundamental strategy failure, or normal variance. Many professional firms implement automated circuit breakers that halt all trading when drawdown thresholds are exceeded, completely removing emotional decision-making from the process during stressful periods.
Drawdown reveals the truth about your trading. It measures not just losses but your capacity to survive the inevitable rough patches every trading career encounters.
Successful long-term traders aren't the ones who avoid drawdowns—that's impossible. They're the traders who keep drawdowns within manageable ranges through disciplined position sizing, consistent stop-loss implementation, and willingness to reduce activity or pause entirely when conditions deteriorate.
Calculate your maximum acceptable drawdown before you place your first trade, not after you're already down 30%. Track your drawdown in real-time alongside your account balance. When drawdown exceeds your predetermined limits, have the discipline to step back and reassess rather than doubling down hoping for quick recovery through aggressive trading.
Your trading career longevity will be defined by how you handle drawdown periods, not by your performance during winning streaks. Prepare for drawdowns systematically, manage them without emotion, and you'll join the small percentage of traders who survive long enough to achieve consistent profitability. The traders who fail? They're the ones who didn't take drawdown seriously until it was too late.
Unsystematic risk represents investment uncertainty tied to specific companies or assets rather than broad market forces. Unlike systematic risks affecting all securities, firm-specific risks can be substantially reduced through proper diversification across 20-30 uncorrelated positions
Markets don't just move—they accelerate, decelerate, and shift gears. Volatility risk is the danger that unexpected changes in price swing intensity will damage your positions. Unlike directional risk, it strikes when market pace changes, hurting options traders, currency speculators, and leveraged investors alike
Volatility clustering describes how large price changes tend to follow large changes, and calm periods extend—one of the most consistent patterns in financial markets. Understanding this phenomenon transforms risk management and trading strategy across forex, equities, and other assets
Systematic risk affects entire markets simultaneously—no diversification can eliminate it. Through concrete examples from interest rate changes to geopolitical events, understand how market-wide forces impact portfolios and learn practical measurement and management strategies using beta and asset allocation
The content on this website is provided for general informational and educational purposes only. It is intended to explain concepts related to Forex (FX) trading, currency markets, leverage, hedging, and risk management.
All information on this website, including articles, guides, and examples, is presented for general educational purposes. Forex trading carries significant risk, and outcomes may vary depending on market conditions, leverage, and individual decisions.
This website does not provide financial, investment, or trading advice, and the information presented should not be used as a substitute for consultation with qualified financial professionals.
The website and its authors are not responsible for any errors or omissions, or for any outcomes resulting from decisions made based on the information provided on this website.