Before you enter your next trade, ask yourself: if I'm wrong, I'll lose $100—but if I'm right, how much will I make? That single question determines whether you're trading with an edge or just hoping for luck. The reward to risk ratio turns gut feelings into measurable odds.
What Is Reward to Risk Ratio in Trading
Think of reward to risk ratio as the price tag on opportunity. It compares how much profit you're shooting for against the loss you'll accept if things go south. Every trade has three critical prices: where you get in, where you'll bail if you're wrong, and where you'll cash out if you're right. The relationship between these three numbers creates your ratio.
Let's say you're buying at $50 per share. You've decided that if price drops to $48, your trade idea is busted, so that's your stop-loss. Looking at the chart, you see resistance at $56 where you'll take profit. You're risking $2 to chase $6. That's a 1:3 ratio—risk one dollar for every three dollars of potential gain.
Markets don't hand out guaranteed wins. No strategy works every time. What you can control is making sure that when you do win, the payoff justifies the times you'll lose. A trader who structures trades at 1:3 only needs to be correct 26% of the time to avoid losing money. Compare that to someone trading at 1:1, who must win half their trades just to tread water.
This filtering mechanism keeps you out of mediocre setups. You might feel 80% sure about a trade, but if the chart only offers 1:1, many experienced traders will pass. Why? Because confidence doesn't equal profit. Math beats feelings when you're looking at 100 trades over six months.
How to Calculate Risk Reward Ratio
Grab three numbers: entry price, stop-loss price, and take-profit price. The math takes about ten seconds.
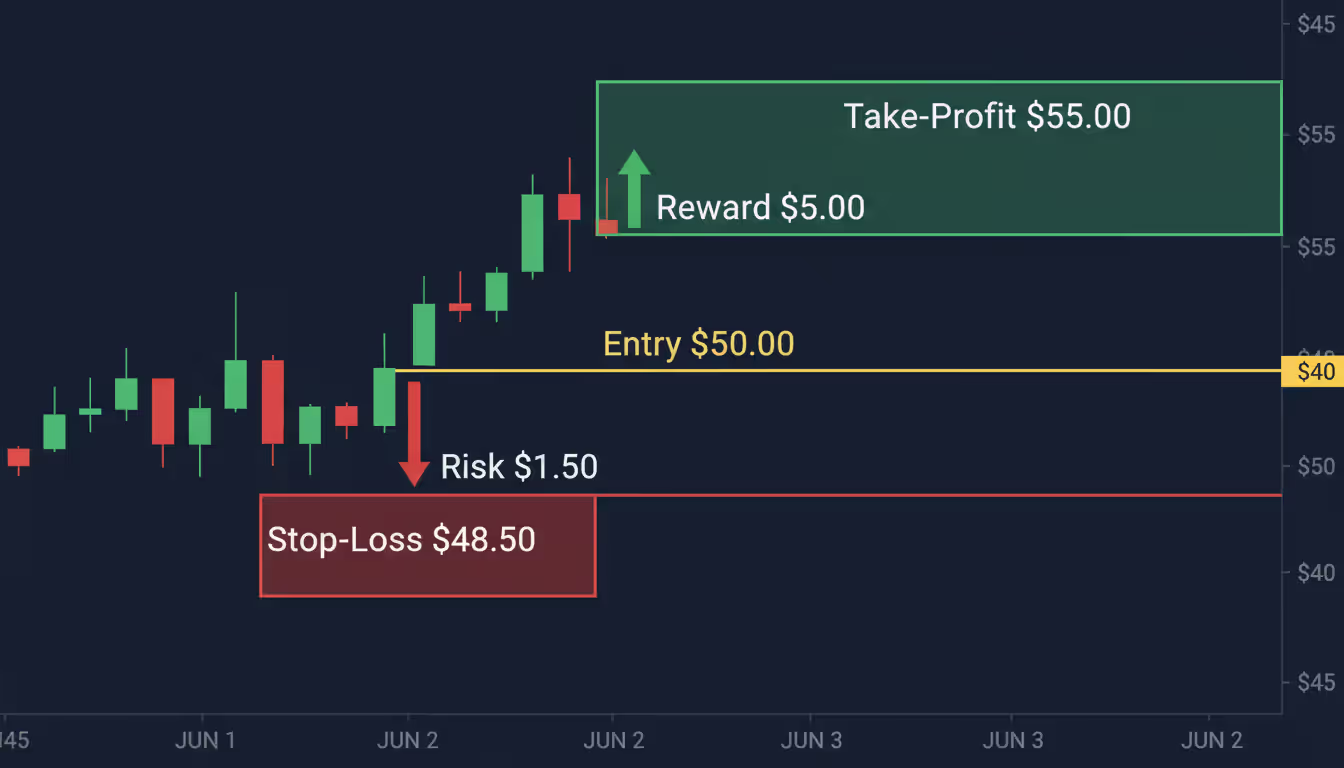
Here's how it works when you're buying. You enter a stock at $50.00. Technical analysis tells you that $48.50 is where your trade idea breaks down, so that's your stop. You've spotted resistance at $55.00 from previous price action, making it your target.
Entry: $50.00
Stop-loss: $48.50
Take-profit: $55.00
Your risk per share: $50.00 - $48.50 = $1.50
Your potential reward per share: $55.00 - $50.00 = $5.00
Divide reward by risk: $5.00 / $1.50 = 3.33
You've got a 1:3.33 ratio. For every $1.50 you risk, you're targeting $5.00 in profit.
Author: Vanessa Cole;
Source: martinskikulis.com
Short trades flip the calculation. Shorting at $50.00 with a stop at $52.00 and a target of $44.00 looks like this:
Risk: $52.00 - $50.00 = $2.00
Reward: $50.00 - $44.00 = $6.00
Ratio: $6.00 / $2.00 = 3.0, which is 1:3
Position size scales your dollar amounts but leaves the ratio untouched. Buy 100 shares with $1.50 risk per share, and you're risking $150 total to make $500. Buy 1,000 shares, and you're risking $1,500 to make $5,000. Same 1:3.33 ratio either way.
Plenty of traders flip this process around. Start with how much you're comfortable losing. Willing to risk $200? With a $1.50-per-share stop, you can trade 133 shares. At 1:3.33, that $200 risk aims for a $666 reward.
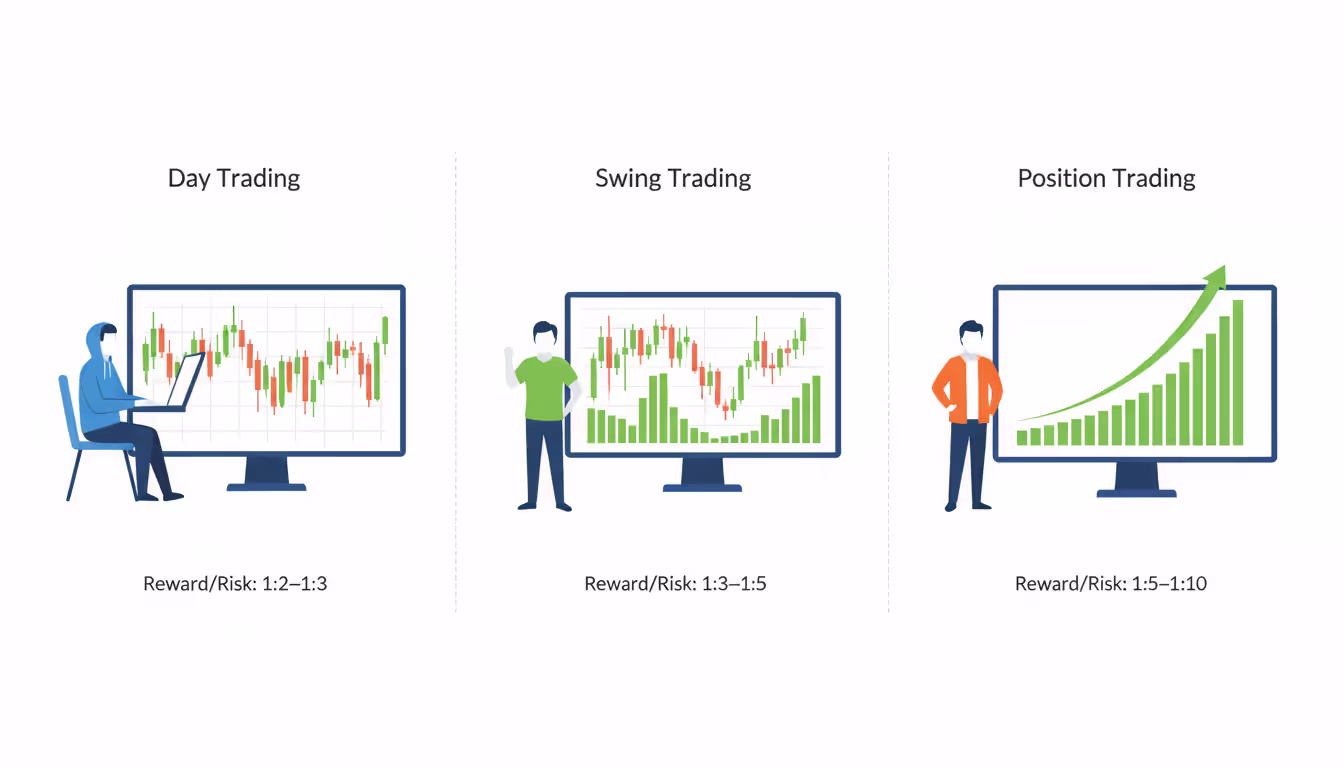
Ideal Risk Reward Ratios by Trading Style
Your trading timeframe dictates realistic ratio targets. Holding for two hours versus two months creates completely different reward possibilities.
Risk Reward Ratio for Day Trading
Day trading compresses everything. You're fighting for scraps of intraday movement, which means your ratios shrink compared to longer-term approaches. Most day traders won't touch anything below 1:2, and 1:3 is the preferred baseline.
Scalpers capturing quick momentum bursts might accept 1:1.5 when they're trading near obvious support with high win probability. They'll execute eight or twelve trades in a session, winning 55-65% of them. Volume compensates for smaller ratios.
Breakout traders chasing gaps or range expansions often push for 1:3 or better. They know their win rate will drop—maybe 40% or less—but those winners deliver enough to cover multiple small losses. The hardest part is intraday volatility. Price swings back and forth, triggering stops on trades that eventually would've worked.
Trading news events like earnings or Fed announcements can create 1:4 or 1:5 setups. You're betting on explosive moves. Win rate might crater to 30%, but that one trade catching a 5% surge in twenty minutes pays for a week of losses.
Ideal Risk Reward in Forex Trading
Currency markets never sleep, and leverage runs high. These two factors make ratio discipline absolutely critical. Most forex professionals treat 1:2 as the bare minimum, with many refusing anything less than 1:3.
Pair selection matters enormously. EUR/USD during London-New York session overlap offers clean 1:2.5 opportunities because liquidity is deep and spreads are tight. Try trading USD/ZAR or EUR/TRY, and you might see 1:5 on paper, but spreads and slippage destroy that advantage when you actually execute.
Carry traders holding for weeks might work with 1:1.5 ratios but collect interest differentials that supplement trade profits. Swing traders in forex typically shoot for 1:3 to 1:4, holding through daily noise to capture larger trend moves over several sessions.
Leverage multiplies everything—including mistakes. A 1:2 trade using 50:1 leverage can vaporize 20% of your account if the stop triggers. You need pristine ratio discipline because one sloppy trade does catastrophic damage.
Swing Trading and Position Trading Ratios
Holding trades for days pushes your minimum ratio to 1:3. Why? Overnight risk. Gaps happen. News breaks at 6 AM before you can react. That extra uncertainty demands larger rewards to justify the exposure.
Position traders measuring moves in months regularly structure trades at 1:5, 1:8, even 1:10. They're risking 5-10% of a stock's value to capture 50-100% appreciation over half a year. Win rates drop below 40%, but individual winners dwarf the losers.
Picture buying a stock at $30, placing a stop at $27 (10% risk), and targeting $60 over eight months (100% gain). That's 1:10. Lose seven trades at $3 each—that's $21 down the drain. Win three trades at $30 each—you're up $90. Net profit: $69 despite winning just 30% of the time.
Author: Vanessa Cole;
Source: martinskikulis.com
Risk Reward and Win Rate Relationship
Here's the non-negotiable math: your ratio determines how often you must win to avoid losing money. You can't separate the two.
Different ratios shift your accuracy requirements dramatically:
Risk/Reward Ratio
Break-Even Win Rate
Example: 100 Trades ($100 risk each)
1:1
50.0%
50 winners = $5,000 gain, 50 losers = $5,000 loss, net $0
1:1.5
40.0%
40 winners = $6,000 gain, 60 losers = $6,000 loss, net $0
1:2
33.3%
34 winners = $6,800 gain, 66 losers = $6,600 loss, net +$200
1:3
25.0%
25 winners = $7,500 gain, 75 losers = $7,500 loss, net $0
1:4
20.0%
20 winners = $8,000 gain, 80 losers = $8,000 loss, net $0
1:5
16.7%
17 winners = $8,500 gain, 83 losers = $8,300 loss, net +$200
Notice the pattern: better ratios buy you permission to be wrong more often. Maintain 1:3 ratios consistently, and you can lose 75% of your trades without going backward. Push to 1:5, and an 83% loss rate still breaks even.
But here's the catch—higher targets are harder to hit. A 1:5 trade needs price to travel five times farther in your direction than against you. Resistance zones, profit-taking by other market participants, and simple random volatility all conspire to stop you out before reaching ambitious targets. Your win rate naturally falls as ratios climb.
Different strategies find different equilibriums. Breakout traders might land 35% win rates at 1:3 ratios. Mean-reversion traders might hit 65% with 1:1.5 ratios. Both make money. The secret is matching your approach to realistic ratio expectations and then staying consistent across dozens of trades.
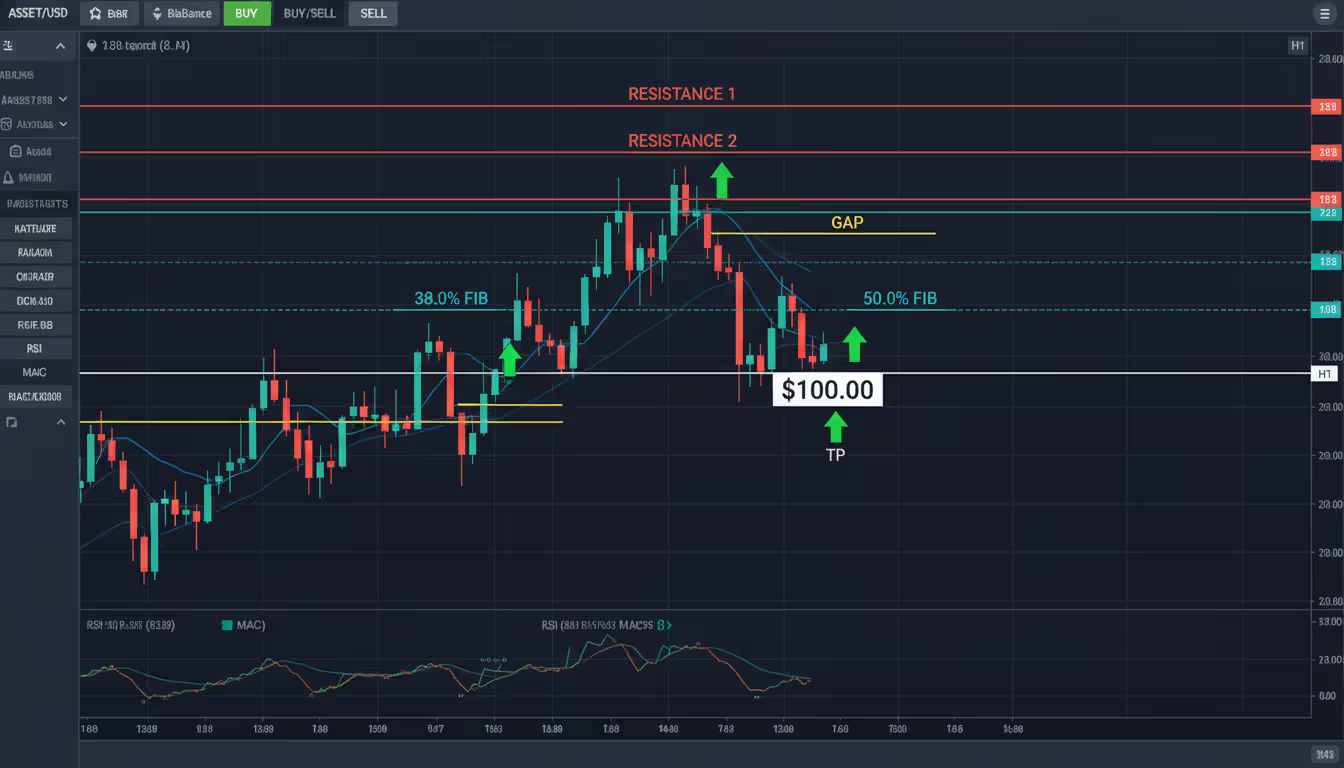
Setting Take Profit Levels Using Risk Reward
Here's where traders sabotage themselves: they calculate a perfect 1:3 ratio, then slap their take-profit order in the middle of a resistance cluster that's reversed price five times in two months. The ratio is meaningless if your target sits in a brick wall.
Start with the chart, not the calculator. Where are the logical exit points? Previous swing highs. Fibonacci extensions. Major round numbers ($50.00, $100.00 in stocks or 1.0000, 1.1000 in forex). Unfilled gaps. These technical levels are where price tends to pause or reverse.
Author: Vanessa Cole;
Source: martinskikulis.com
Once you've identified realistic exit zones, work backward. You want to buy at $42, and your analysis says a stop at $40 protects against invalidation—that's $2 at risk. Strong resistance from multiple tests sits at $48. That offers $6 of reward for $2 of risk, giving you 1:3. Perfect alignment.
But what if the nearest meaningful resistance is at $44? That's only $2 reward for $2 risk—a 1:1 ratio. Now you've got a choice: pass on the trade entirely, or tighten your stop to improve the ratio (which might get you stopped out by normal price fluctuation).
Scaling out solves some dilemmas. Risk $1, take 50% off the position at $2 profit (1:2 on that half), and let the remaining 50% run to $4 (1:4 on that half). Your blended ratio works out above 1:2.5, and you've locked in partial gains while keeping upside potential.
Never set arbitrary targets. "I need 1:3, so I'll measure three times my stop distance and place my target there" ignores what the chart is telling you. Price doesn't care about your ratio requirements. It responds to supply and demand. Your job is finding setups where market structure naturally aligns with attractive ratios.
Timeframe matters substantially. Day traders target the next meaningful level 2-4% away. Swing traders can aim for zones 10-20% distant. The longer you're willing to hold, the more price has time to reach ambitious targets.
How Risk Reward Affects Position Sizing and Profitability
Even a gorgeous 1:5 ratio becomes reckless if you're betting 40% of your account. Ratio and position sizing form two halves of risk management.
Most professionals risk 0.5% to 2% of capital per trade. With a $50,000 account, a 1% risk tolerance means you're willing to lose $500 on the trade. Your position size flows from that limit.
Back to our earlier example: entry at $50, stop at $48.50, risk of $1.50 per share. Divide your $500 risk tolerance by $1.50, and you get 333 shares. Hit your 1:3.33 target, and you bank $1,665 (growing your account to $51,665). Lose, and you drop to $49,500.
The minimum risk reward threshold acts as a filter. Many traders refuse setups below 1:2 no matter how confident they feel. This threshold prevents death by a thousand cuts—taking mediocre trades that barely move your account even when they win.
Picture fifty trades at 1:1 with a 50% win rate. You break even before commissions, then commissions put you in the red. You've spent hours analyzing and monitoring for a net loss. Now picture fifty trades at 1:3 with a 35% win rate. Seventeen wins earn 51 units. Thirty-three losses cost 33 units. You're up 18 units after the same number of trades.
Consistency compounds over time. A trader averaging 1:2.5 with 40% accuracy generates steady profits month after month. A trader taking whatever looks decent—mixing 1:1 trades with occasional 1:4 winners—produces erratic results that are impossible to improve because there's no baseline to analyze.
Portfolio heat connects ratio to overall exposure. Five open positions, each risking 1% at 1:3 ratios, means you're risking 5% to potentially gain 15%. That's reasonable. Five positions at 1:1 ratios means risking 5% to gain 5%, which barely covers the probability that two or three will fail.
Successful trading isn't about being right—it's about managing risk and ensuring your winners exceed your losers by enough to survive your inevitable mistakes. Master your risk-to-reward thinking, and you can be wrong more than half the time and still build wealth
— Dr. Van K. Tharp
Common Mistakes That Hurt Your Risk Reward Ratio
Moving your stop-loss after entry destroys your ratio faster than any other mistake. Price drifts toward your stop. Panic floods in. Instead of accepting the $100 loss, you shove the stop another $100 lower, convincing yourself you're "giving it room." What started as 1:3 (risk $100 to make $300) just became 1:1.5 (risk $200 to make $300). Do this three times, and your strategy becomes unworkable regardless of win rate.
Early exits are equally toxic. Your trade climbs halfway to target, showing a nice unrealized gain. Fear of giving it back tempts you to close. You capture 1:1.5 instead of the planned 1:3. Repeat this pattern, and your actual achieved ratios drop far below your theoretical ratios, requiring a much higher win rate than your strategy was designed for.
Forcing trades into ratio targets when the chart doesn't cooperate leads to fantasy planning. You spot a setup where the logical stop is tight and the nearest resistance is close—maybe 1:1.5. Rather than passing, you place your take-profit beyond that resistance, claiming you've got a 1:3 setup. Price smacks into resistance and reverses, stopping you out. You've lied to yourself with an impossible target.
Volatility ignorance causes similar failures. A stock that normally swings 2% per day won't reliably move 8% in a single session. Your "1:4 day trade" is structurally impossible given how the instrument actually behaves. Check average true range and recent price action before setting targets.
Author: Vanessa Cole;
Source: martinskikulis.com
Here's how to actually improve your ratio execution:
Plan every trade on paper before entry. Write down entry price, stop price, target price, share size, and ratio. Lock it in. No adjustments after you're in the trade unless market structure fundamentally changes (like a gap that invalidates your entire setup).
Use alerts, not constant screen watching. Staring at positions triggers emotional interference. Set a price alert near your target and another at your stop. Walk away. Let the trade either work or fail without your input.
Journal planned versus achieved ratios. Track every trade. If you plan 1:3 trades but actually average 1:1.8, you're sabotaging yourself. Dig into why—early exits? Stops too tight? Unrealistic targets?
Accept that some good setups offer modest ratios. A high-probability mean-reversion play off major support might only deliver 1:1.5. If your win rate on these is 70%, that's perfectly tradable. Don't force-fit every opportunity into a 1:3 box.
Scale intelligently if you take partial profits. Grab 25% at 1:2, hold 75% for 1:4. Your blended ratio stays above 1:3. This satisfies the psychological urge to lock in gains while maintaining solid overall math.
Frequently Asked Questions About Risk Reward Ratio
What is a good reward to risk ratio for beginners?
Start with 1:2 as your floor. This cushions you through the learning curve while only requiring 33% accuracy to break even. Once you've logged fifty trades with consistent execution, experiment with 1:3 or higher. Beginning with achievable ratios builds proper habits instead of frustrating you with targets you can't reach yet.
Can you be profitable with a 1:1 risk reward ratio?
Yes, if you win more than 50% of the time and keep costs low. Certain mean-reversion strategies hit 65-70% win rates at 1:1 or 1:1.5 ratios. The challenge is sustaining that high accuracy—most traders find it easier to improve their ratio than maintain 60%+ win rates across hundreds of trades.
Should I always use the same risk reward ratio?
No. Market structure determines appropriate ratios for each setup. Breakouts into empty chart space might offer 1:5. Trades near resistance with limited room might only give 1:2. Set a floor (like 1:2) and take anything above that when the chart supports it. Forcing identical ratios on every trade ignores what price is actually doing.
What is the minimum risk reward ratio I should accept?
Most full-time traders draw the line at 1:2, with many insisting on 1:2.5 or higher. Below 1:2, you need win rates above 40% just to break even, and commissions chip away at thin edges. A 1:2 minimum means even a modest 40% win rate produces profits after enough trades.
How does risk reward ratio differ from win rate?
Ratio measures the size of your wins compared to your losses. Win rate counts how often you win. These are separate metrics that interact. A trader winning 30% at 1:4 can crush a trader winning 60% at 1:1. Both numbers matter, but ratio determines the accuracy you need, while win rate determines how often you collect those rewards.
Does a higher risk reward ratio guarantee profits?
Not remotely. A 1:10 ratio is worthless if you only hit target 8% of the time. Higher ratios usually lower win rates because targets are farther away and harder to reach. You need balance between achievable targets and favorable ratios. Consistent 1:2.5 at 45% accuracy beats aspirational 1:8 at 10% accuracy every time.
The math is simple: define your potential gain and your potential loss before risking a dollar. This transforms trading from hope into probability. The ratio you choose dictates how accurate you need to be—higher ratios let you lose more often, but only if those targets are realistic based on actual chart structure, not wishful thinking.
Day traders generally work in the 1:2 to 1:3 range. Swing and position traders push toward 1:3 to 1:5 or beyond. Your strategy, timeframe, and natural win rate should guide your minimum acceptable ratio. Most professionals won't trade below 1:2, understanding that modest ratios demand accuracy levels that are difficult to sustain.
Position sizing and ratio work as partners. Risk 1-2% per trade with consistent 1:2.5+ ratios, and gains compound over time while losses stay manageable. What matters most is your achieved ratio, not your planned ratio—if you keep moving stops or closing winners early, you're destroying your edge.
Record planned and actual ratios for every trade. Look for patterns where you deviate. Establish a minimum threshold and stick to it, even when you feel certain about a setup that doesn't meet your criteria. New opportunities appear constantly, but capital is finite. Protect yours by demanding favorable odds every single time.
Unsystematic risk represents investment uncertainty tied to specific companies or assets rather than broad market forces. Unlike systematic risks affecting all securities, firm-specific risks can be substantially reduced through proper diversification across 20-30 uncorrelated positions
Markets don't just move—they accelerate, decelerate, and shift gears. Volatility risk is the danger that unexpected changes in price swing intensity will damage your positions. Unlike directional risk, it strikes when market pace changes, hurting options traders, currency speculators, and leveraged investors alike
Volatility clustering describes how large price changes tend to follow large changes, and calm periods extend—one of the most consistent patterns in financial markets. Understanding this phenomenon transforms risk management and trading strategy across forex, equities, and other assets
Systematic risk affects entire markets simultaneously—no diversification can eliminate it. Through concrete examples from interest rate changes to geopolitical events, understand how market-wide forces impact portfolios and learn practical measurement and management strategies using beta and asset allocation
The content on this website is provided for general informational and educational purposes only. It is intended to explain concepts related to Forex (FX) trading, currency markets, leverage, hedging, and risk management.
All information on this website, including articles, guides, and examples, is presented for general educational purposes. Forex trading carries significant risk, and outcomes may vary depending on market conditions, leverage, and individual decisions.
This website does not provide financial, investment, or trading advice, and the information presented should not be used as a substitute for consultation with qualified financial professionals.
The website and its authors are not responsible for any errors or omissions, or for any outcomes resulting from decisions made based on the information provided on this website.