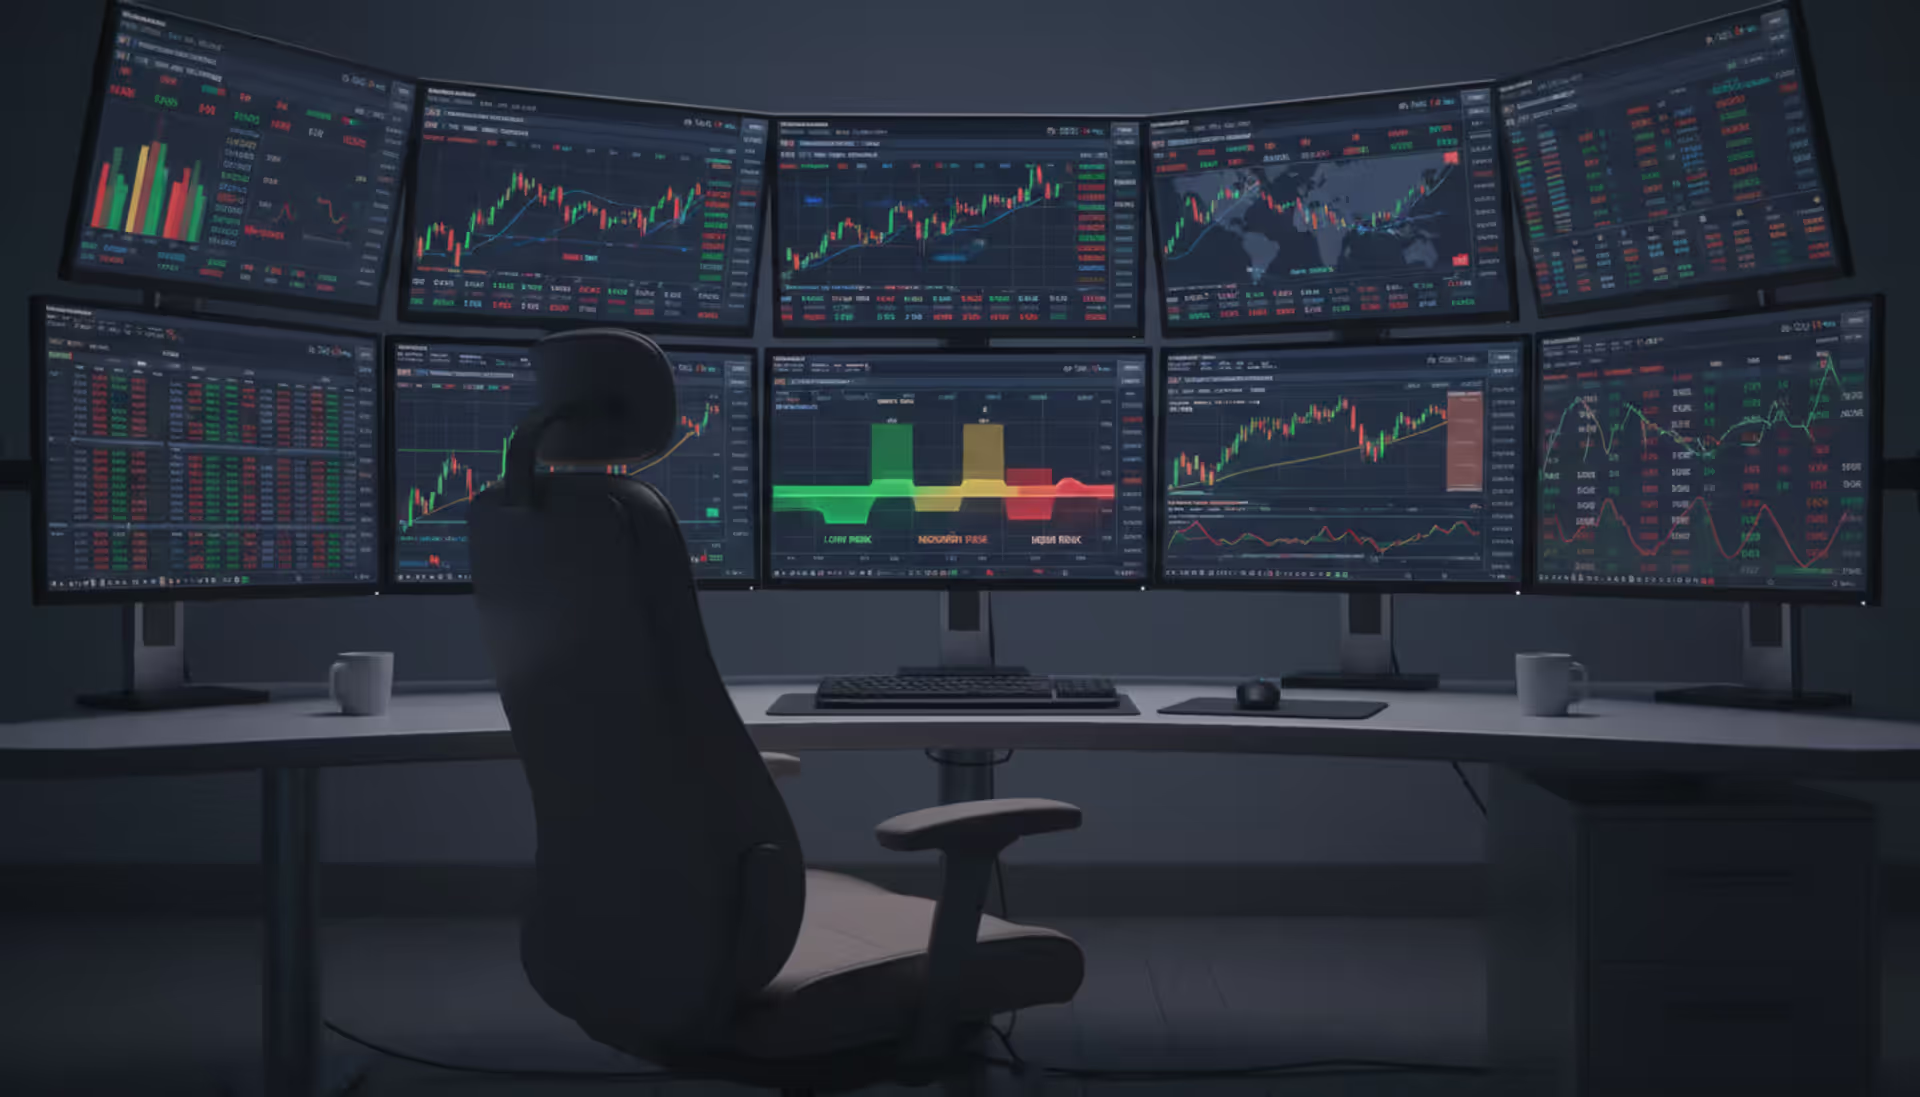
Market participants face constant uncertainty. Price swings, economic shifts, and geopolitical events create an environment where gauging danger becomes as important as spotting opportunity. Risk meters emerged as practical tools to quantify this uncertainty, offering traders and investors a structured way to assess market conditions before committing capital.
These instruments don't predict the future. Instead, they synthesize multiple data streams—volatility measures, sentiment indicators, price behavior—into a single, digestible reading. Think of them as the financial equivalent of a weather radar: they show current conditions and help you decide whether to venture out or wait for clearer skies.
Understanding Risk Meters in Trading
A risk meter is a quantitative tool that aggregates various market signals to produce a unified risk score or classification. The output typically appears as a numerical value, color-coded gauge, or categorical rating (low, moderate, high, extreme). Financial institutions, retail brokers, and independent traders use these tools to make informed decisions about position sizing, asset allocation, and timing.
Professional traders at hedge funds and proprietary trading desks often build custom risk meters tailored to their strategies. Retail investors, meanwhile, rely on simplified versions provided by brokerage platforms or financial websites. The core purpose remains consistent across all implementations: translating complex market dynamics into actionable intelligence.
Market risk measurement tools serve three primary functions. First, they provide a snapshot of current market stress levels. Second, they help identify regime changes—shifts from calm to turbulent conditions or vice versa. Third, they offer a framework for comparing risk across different assets, sectors, or timeframes.
Individual investors use risk meters to adjust portfolio exposure. When readings spike into high-risk territory, conservative investors might reduce equity positions or increase cash allocations. Aggressive traders might see the same signal as an opportunity to capitalize on volatility through options or leveraged instruments.
Institutional players incorporate these tools into risk management systems. A pension fund might set policy rules that automatically adjust asset weights when risk indicators breach predetermined thresholds. An investment bank's trading desk could use proprietary risk scores to determine maximum position sizes for individual traders.
How Risk Meters Measure Market Risk
The mechanics behind risk meters vary widely, but most rely on mathematical models that process raw market data into standardized outputs. Volatility calculations form the foundation for many systems. Historical volatility measures how much an asset's price has fluctuated over a specific period, while implied volatility extracts market expectations from option prices.
Algorithmic scoring systems assign weights to different inputs based on their perceived importance. A simple model might give 50% weight to recent price volatility, 30% to trading volume changes, and 20% to news sentiment scores. More sophisticated approaches use machine learning algorithms that adjust weightings dynamically based on market conditions.
Technical indicators contribute valuable signals. The Average True Range (ATR) measures price movement magnitude without regard to direction. Bollinger Band width expands during volatile periods and contracts during calm ones. Rate of change indicators detect acceleration in price movements, often precursors to increased risk.
Risk scoring in trading extends beyond single-asset analysis. Portfolio-level risk meters aggregate individual position risks while accounting for correlations. If you hold ten stocks that typically move together, your actual diversification—and therefore risk—differs dramatically from holding ten uncorrelated positions.
Some systems incorporate fundamental data: earnings volatility, debt levels, sector rotation patterns. Others focus purely on price action and derivatives markets. The most comprehensive tools blend multiple data sources, creating what practitioners call "multi-factor risk models."
Real-time calculation presents technical challenges. Markets generate thousands of data points per second. Effective risk meters must filter noise from signal, updating frequently enough to remain relevant without producing so many false alarms that users ignore them.
Types of Risk Gauge Indicators
Risk gauge indicators fall into several categories, each with distinct methodologies and applications. Understanding these differences helps traders select appropriate tools for their specific needs.
Volatility-Based Risk Meters
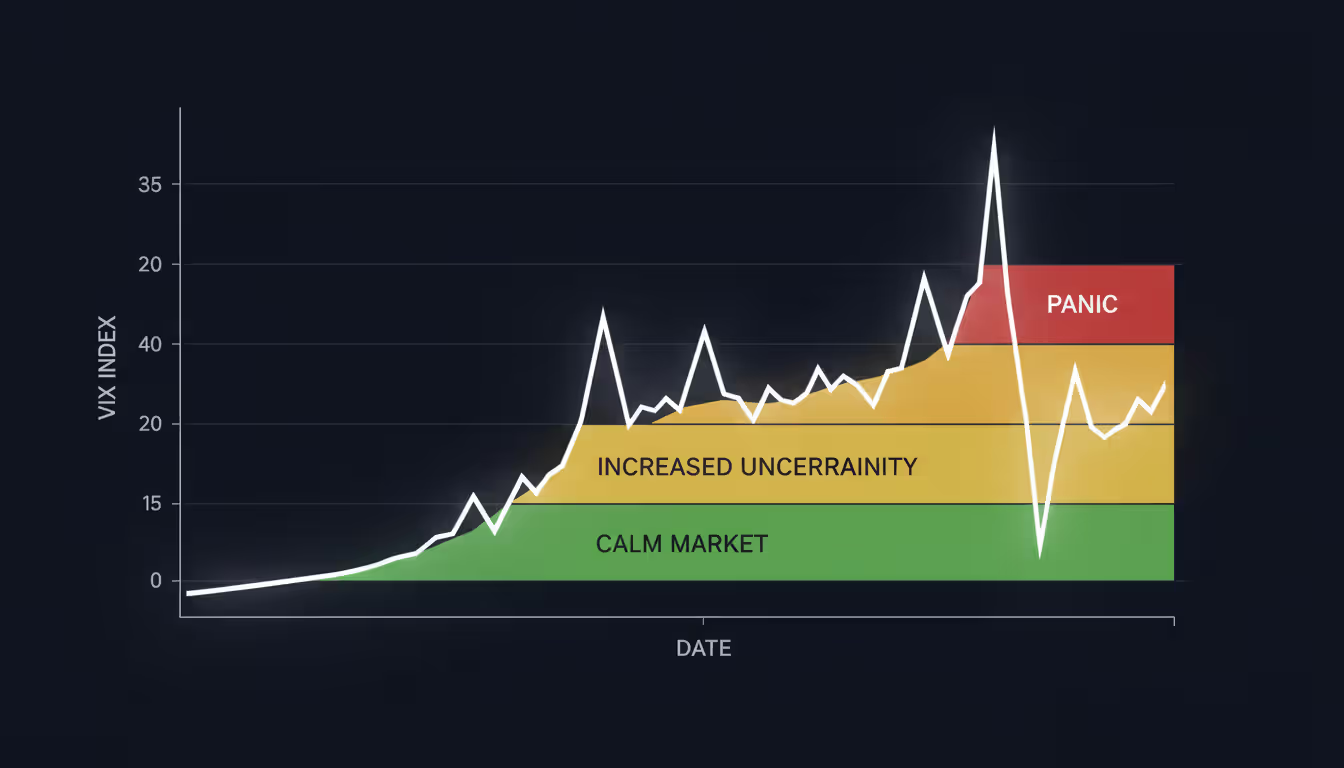
The VIX (Volatility Index) stands as the most recognized volatility risk meter. Calculated by the Chicago Board Options Exchange, it measures expected 30-day volatility implied by S&P 500 index options. When the VIX rises above 20, markets typically experience heightened uncertainty. Readings above 30 indicate significant stress, while levels exceeding 40 suggest panic conditions.
Author: Ethan Blackwell;
Source: martinskikulis.com
Other volatility-based tools include the MOVE Index for bond market volatility and currency-specific volatility indexes like the EVZ for euro-dollar exchange rate fluctuations. These instruments share a common trait: they reflect market participants' collective anxiety as expressed through option premiums.
Individual brokers offer proprietary volatility risk meters that apply similar principles to specific assets or portfolios. These might calculate rolling standard deviations over various timeframes, then map results to a five-point scale or 0-100 range.
Risk level classification in trading using volatility typically follows rough guidelines: readings in the bottom quartile of historical ranges suggest low risk, middle ranges indicate moderate conditions, and top quartile readings signal elevated danger. However, context matters—a "high" reading during a bull market might represent less actual danger than a "moderate" reading during a bear phase.
Sentiment-Driven Risk Indicators
Sentiment analysis tools parse news articles, social media posts, analyst reports, and other text sources to gauge market mood. Natural language processing algorithms identify positive, negative, or neutral language, then aggregate findings into composite scores.
The AAII Sentiment Survey polls individual investors weekly about their market outlook. Extreme bullishness often coincides with market tops, while excessive pessimism can signal bottoms. Contrarian traders use these readings as reverse indicators.
Put-call ratios measure the volume of bearish put options relative to bullish calls. Unusually high ratios suggest defensive positioning and heightened risk awareness among options traders. Some platforms convert these ratios into standardized risk scores.
Commitment of Traders (COT) reports reveal positioning by commercial hedgers, large speculators, and small traders in futures markets. Extreme positioning by any group can indicate crowded trades vulnerable to reversal—a form of structural risk distinct from volatility.
Risk-On vs Risk-Off Market Conditions
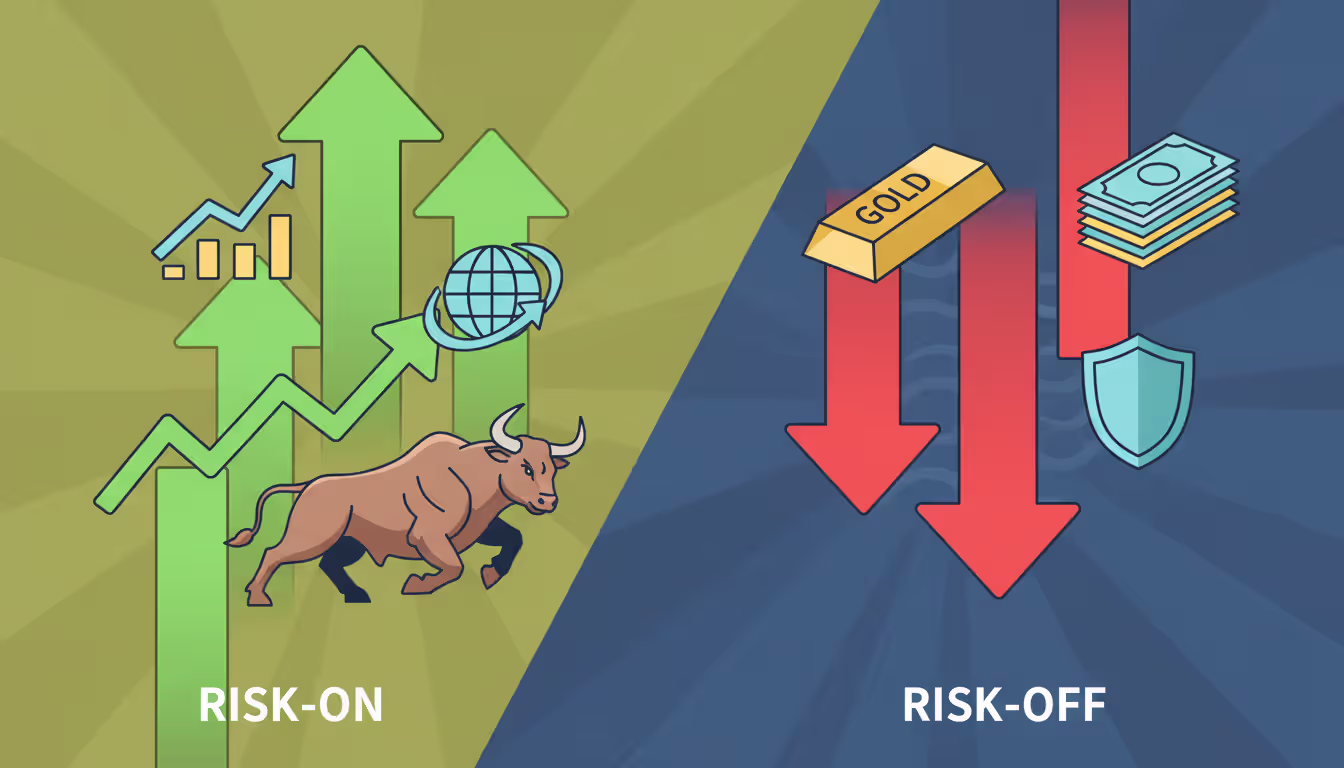
Financial markets oscillate between two broad regimes that risk meters attempt to identify and quantify. Understanding risk-on vs risk-off meaning provides essential context for interpreting any risk indicator.
During risk-on periods, investors display confidence in economic growth and corporate earnings. Money flows into equities, emerging market assets, high-yield bonds, and cyclical sectors. Volatility indexes typically register low readings. Correlations between different asset classes decrease as investors discriminate between opportunities. The dollar often weakens as capital seeks higher returns abroad.
Author: Ethan Blackwell;
Source: martinskikulis.com
Risk-off conditions reverse these patterns. Investors prioritize capital preservation over growth. Funds shift toward government bonds, gold, defensive sectors like utilities and consumer staples, and cash. The dollar strengthens as a safe-haven currency. Volatility spikes. Correlations across risky assets increase—everything falls together regardless of individual fundamentals.
Risk meters reflect these shifts through multiple signals. A meter might show low risk when the VIX sits below 15, high-yield credit spreads remain tight, and breadth indicators show broad market participation. The same tool would flash high risk when the VIX jumps above 25, credit spreads widen, and market breadth narrows to a handful of defensive names.
Real-world examples illustrate these dynamics. In early 2025, markets experienced a brief risk-off episode when unexpected inflation data triggered concerns about prolonged high interest rates. Risk meters spiked as the VIX jumped from 14 to 28 within three trading sessions. Equity markets fell 8%, while Treasury bonds rallied and gold surged. Within six weeks, reassuring economic data restored confidence, risk meters declined, and stocks recovered losses.
Traders adjust strategies based on regime identification. Momentum and growth strategies tend to outperform during risk-on periods. Mean reversion and value approaches often work better during risk-off phases. Options sellers profit from elevated premiums when risk meters read high, while buyers benefit from cheap protection during low-risk periods—assuming they correctly anticipate regime changes.
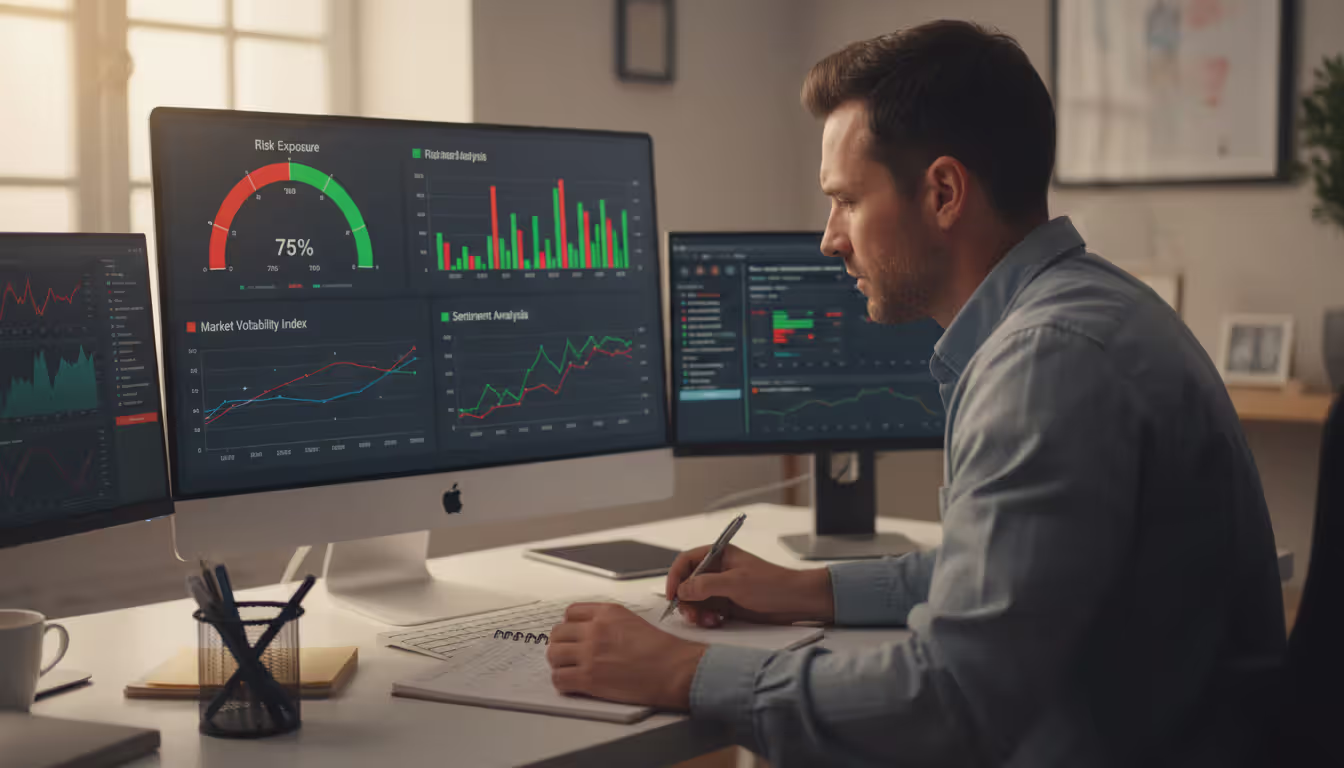
How to Read and Interpret a Risk Indicator
Effective interpretation requires understanding both the indicator's construction and its limitations. Most risk meters use standardized scales: 0-100 numerical ranges, five-tier classifications (very low, low, moderate, high, very high), or color-coded gauges (green, yellow, orange, red).
Author: Ethan Blackwell;
Source: martinskikulis.com
Start by establishing baseline context. What's normal for this indicator? The VIX averages around 15-20 during typical market conditions. A reading of 18 might be neutral, while 35 represents genuine stress. For a proprietary broker tool, review historical data to understand its typical range and how past extremes corresponded to actual market events.
Check the timeframe. Some risk meters measure short-term volatility (daily or weekly), while others focus on intermediate (monthly) or long-term (quarterly) horizons. A day trader needs different information than a retirement investor adjusting annual allocations.
Combine multiple indicators rather than relying on a single source. If your broker's risk meter shows elevated risk, but the VIX remains calm and credit spreads are stable, investigate the discrepancy. Perhaps the broker's tool emphasizes factors specific to your portfolio that don't reflect broader market conditions.
Sentiment and risk measurement tools offer complementary perspectives. A volatility-based meter might show low risk because recent price swings have been minimal, while a sentiment indicator reveals extreme optimism—historically a warning sign. This divergence suggests complacency, a dangerous condition that precedes many corrections.
Watch for divergences between risk indicators and price action. If markets grind higher while risk meters steadily rise, participants are paying more for protection even as prices climb. This often indicates fragile confidence vulnerable to reversal.
Consider absolute levels versus rates of change. A risk meter reading of 60 that's falling from 80 suggests improving conditions despite the elevated absolute level. Conversely, a reading of 40 that's rapidly rising from 20 might warrant more concern than the moderate absolute number suggests.
Establish personal action thresholds before consulting indicators. Decide in advance: "If my risk meter exceeds 75, I'll reduce equity exposure by 20%." This prevents emotional decision-making during stressful periods when clear thinking becomes difficult.
Common Mistakes When Using Risk Measurement Tools
Risk meters provide valuable information, but they measure the past and present, not the future. The most dangerous market conditions often emerge when traditional risk indicators show calm. Effective risk management requires combining quantitative tools with qualitative judgment about what might be mispriced or overlooked. No algorithm can fully capture tail risks or structural changes in market dynamics
— Dr. Rachel Mendoza
Over-reliance on single indicators creates false confidence. No tool captures every dimension of market risk. A trader who blindly follows one risk meter might miss important signals from other sources. Diversify your information sources just as you diversify investments.
Ignoring market context leads to misinterpretation. A VIX reading of 22 means different things during a bull market rally versus a bear market bounce. During sustained uptrends, that level might signal genuine concern. During downtrends, it could represent temporary exhaustion of selling pressure rather than true risk reduction.
Misinterpreting timeframes causes costly errors. A risk meter designed for swing traders holding positions for days or weeks provides little value to investors making quarterly allocation decisions. Match the indicator's design to your actual holding period and trading style.
Chasing lagging indicators wastes opportunities. Some risk meters primarily reflect past volatility. By the time they signal high risk, the worst price damage may have already occurred. Similarly, low-risk readings might persist after attractive entry points have passed.
Failing to account for indicator construction creates blind spots. If your risk meter heavily weights equity volatility but you trade mostly bonds, its readings may poorly reflect your actual risk exposure. Understand what goes into the calculation and whether it aligns with your holdings.
Treating risk meters as predictive rather than descriptive sets unrealistic expectations. These tools describe current conditions or very near-term probabilities. They don't forecast whether markets will crash next month or rally next quarter. Use them for situational awareness, not prophecy.
Neglecting to adjust for changing market structure introduces errors. Volatility patterns shift over time due to algorithmic trading, options market growth, and regulatory changes. A risk level considered extreme in 2015 might be routine in 2026. Regularly recalibrate your understanding of what constitutes normal versus elevated readings.
Comparison of Popular Risk Meter Types
Tool/Indicator Name
What It Measures
Best Used For
Risk Scale/Range
Update Frequency
VIX (CBOE Volatility Index)
Expected 30-day S&P 500 volatility from options
Broad US equity market risk assessment
10-80+ (typical: 12-20)
Real-time during market hours
MOVE Index
Expected 30-day Treasury bond volatility
Fixed income and interest rate risk
50-150+ (typical: 70-90)
Daily
High-Yield Credit Spreads
Yield difference between junk bonds and Treasuries
Corporate credit and recession risk
3-10+ percentage points
Daily
Put/Call Ratio
Volume ratio of put vs call options
Sentiment and positioning extremes
0.5-1.5+ (1.0 = neutral)
Daily
Broker Proprietary Meters
Multi-factor portfolio-specific risk
Individual account risk management
0-100 or 5-tier scale
Real-time or end-of-day
Frequently Asked Questions About Risk Meters
What does a risk meter show traders?
A risk meter displays a quantitative assessment of current market conditions, typically combining volatility measures, sentiment data, and technical indicators into a single score or rating. It shows whether markets are experiencing calm, normal, or stressed conditions. Traders use this information to adjust position sizes, set stop-losses, modify strategies, or decide whether to increase or decrease market exposure. The reading reflects collective market behavior rather than predicting specific price movements.
Is a risk meter the same as the VIX?
No. The VIX is one specific type of volatility-based risk indicator that measures expected S&P 500 volatility. Many risk meters incorporate VIX data as one input among several others, including sentiment surveys, credit spreads, breadth indicators, and technical signals. A comprehensive risk meter provides broader market assessment than the VIX alone, though the VIX remains the most widely recognized standalone volatility indicator. Think of the VIX as one ingredient in a recipe rather than the complete dish.
Can beginners use risk meters effectively?
Yes, with proper education and realistic expectations. Beginners should start with simple, well-established indicators like the VIX rather than complex proprietary tools. Learn what the readings mean historically—when has the indicator signaled genuine danger versus false alarms? Use risk meters as one factor in decisions, not the sole determinant. Beginners often benefit most from risk meters as position-sizing guides: reduce exposure when risk readings are high, potentially increase when readings are low and other analysis supports action.
How often should I check a risk indicator?
Frequency depends on your trading timeframe and strategy. Day traders might monitor risk indicators multiple times per session to gauge intraday volatility. Swing traders holding positions for days or weeks could check daily or every few days. Long-term investors making quarterly or annual allocation decisions might review risk indicators weekly or monthly. Excessive checking often leads to overtrading and emotional decisions. Establish a schedule that matches your investment horizon and stick to it.
Do risk meters predict market crashes?
Not reliably. Risk meters identify elevated volatility and stress after these conditions emerge, but they don't forecast crashes with precision. Many severe market declines begin from low-risk environments when complacency reigns. Conversely, high risk readings often persist for extended periods without crashes materializing. Risk meters work better for assessing current conditions and making probability-based adjustments than for predicting specific events. They're thermometers showing temperature, not crystal balls revealing the future.
What risk level is safe for new traders?
"Safe" depends on personal risk tolerance, capital available, and financial goals. As a guideline, new traders should consider reducing or avoiding new positions when risk meters show readings in the top 20% of historical ranges. Focus learning efforts during moderate-risk periods rather than extreme conditions when emotions run high and price action becomes erratic. Many experienced traders suggest beginners limit exposure to 25-50% of available capital until they've weathered multiple market cycles and understand their own psychological responses to volatility.
Risk meters transform abstract market conditions into concrete information that supports better decision-making. These tools synthesize volatility data, sentiment indicators, and technical signals into accessible formats that help traders and investors assess current market environments.
Effective use requires understanding what specific indicators measure, their historical context, and their limitations. No single tool captures all dimensions of market risk. Combining multiple indicators, matching timeframes to your trading horizon, and maintaining realistic expectations about predictive power produces the best results.
Markets will always involve uncertainty. Risk meters don't eliminate that uncertainty, but they provide structure for navigating it. They help answer the practical question every trader faces: given current conditions, how aggressively or defensively should I position my portfolio? The answer emerges not from blind adherence to any indicator, but from integrating quantitative signals with experience, discipline, and sound risk management principles.
Whether you're a beginning investor learning to interpret market signals or an experienced trader refining your approach, risk measurement tools offer valuable perspective. Use them wisely—as information sources rather than decision-makers—and they'll enhance your ability to participate in markets while managing the inevitable ups and downs that characterize financial trading.
Unsystematic risk represents investment uncertainty tied to specific companies or assets rather than broad market forces. Unlike systematic risks affecting all securities, firm-specific risks can be substantially reduced through proper diversification across 20-30 uncorrelated positions
Markets don't just move—they accelerate, decelerate, and shift gears. Volatility risk is the danger that unexpected changes in price swing intensity will damage your positions. Unlike directional risk, it strikes when market pace changes, hurting options traders, currency speculators, and leveraged investors alike
Volatility clustering describes how large price changes tend to follow large changes, and calm periods extend—one of the most consistent patterns in financial markets. Understanding this phenomenon transforms risk management and trading strategy across forex, equities, and other assets
Systematic risk affects entire markets simultaneously—no diversification can eliminate it. Through concrete examples from interest rate changes to geopolitical events, understand how market-wide forces impact portfolios and learn practical measurement and management strategies using beta and asset allocation
The content on this website is provided for general informational and educational purposes only. It is intended to explain concepts related to Forex (FX) trading, currency markets, leverage, hedging, and risk management.
All information on this website, including articles, guides, and examples, is presented for general educational purposes. Forex trading carries significant risk, and outcomes may vary depending on market conditions, leverage, and individual decisions.
This website does not provide financial, investment, or trading advice, and the information presented should not be used as a substitute for consultation with qualified financial professionals.
The website and its authors are not responsible for any errors or omissions, or for any outcomes resulting from decisions made based on the information provided on this website.