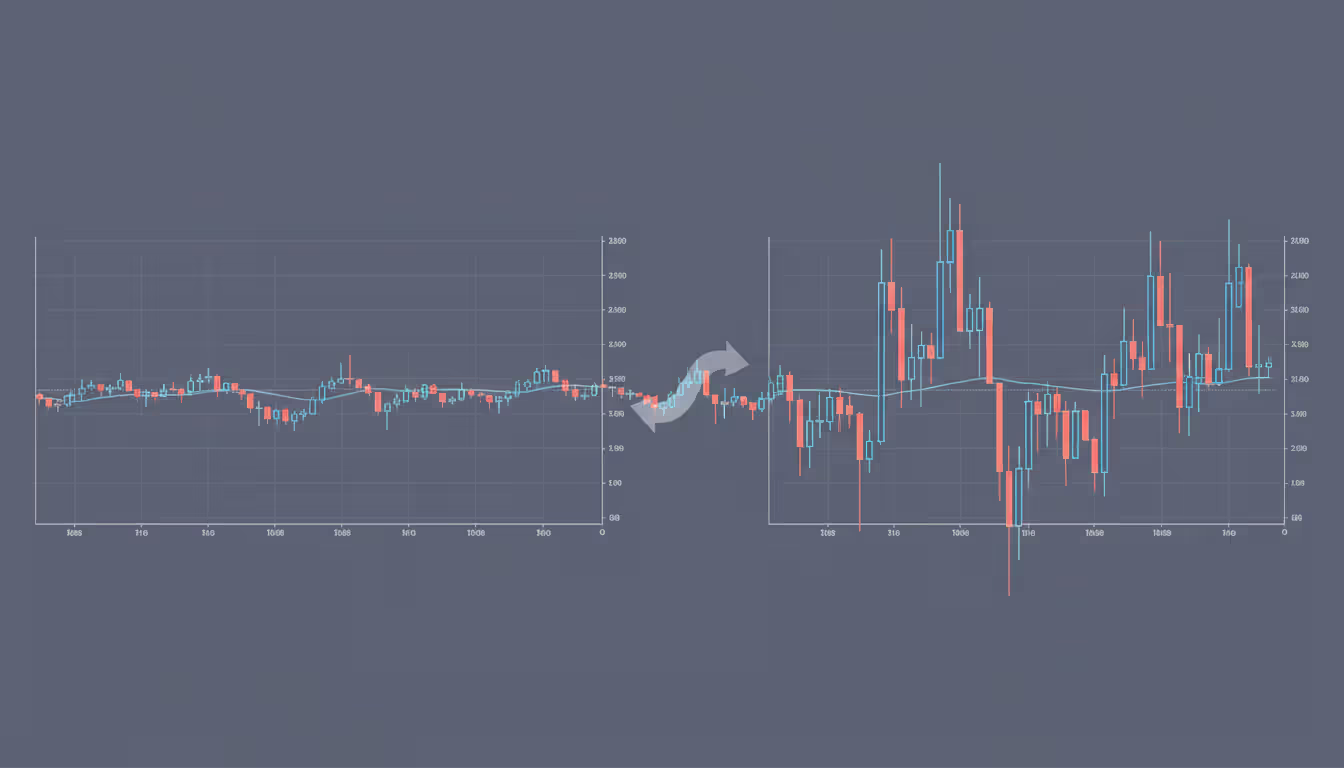
Abstract financial chart showing alternating periods of low and high volatility waves in blue and red-orange colors on dark background illustrating volatility clustering concept
Market volatility rarely moves randomly. Instead, it arrives in waves—calm periods give way to turbulence, which eventually subsides back to relative quiet. This pattern, known as volatility clustering, represents one of the most consistent and observable phenomena across financial markets. Understanding how and why volatility groups together matters for anyone managing market risk or building trading strategies.
Understanding Volatility Clustering
Volatility clustering describes the empirical observation that large price changes tend to follow large price changes, and small price changes tend to follow small price changes. The magnitude of price movements clusters together over time, even though the direction of those movements remains largely unpredictable.
When the EUR/USD pair experiences a 150-pip swing on Monday, there's a higher-than-average probability that Tuesday will also see substantial movement—not because we can predict the direction, but because the market conditions that created Monday's volatility often persist. The same principle applies when markets are quiet: a week of 30-pip daily ranges suggests tomorrow will likely remain subdued.
This clustering behavior contradicts the assumption of constant volatility that underpins many basic financial models. Markets don't maintain steady, uniform price variation. Instead, they alternate between regimes: extended stretches of relative calm punctuated by periods of heightened activity.
The phenomenon appears across timeframes. Intraday traders notice volatility clustering within single sessions—a quiet morning followed by an active afternoon, or vice versa. Position traders observe it across weeks and months, as geopolitical events or policy shifts create sustained periods of market stress that gradually dissipate.
What makes volatility clustering particularly important is its asymmetry with price trends. While price direction shows limited predictability (yesterday's gain doesn't reliably predict today's direction), volatility exhibits strong persistence. A volatile day meaningfully increases the odds of another volatile day ahead, creating patterns that traders and risk managers can incorporate into their decision-making.
Author: Vanessa Cole;
Source: martinskikulis.com
Why Volatility Persists Over Time
Autocorrelation in volatility—the statistical relationship between current and past volatility—provides the mathematical foundation for clustering. When researchers measure the correlation between today's absolute price change and yesterday's absolute price change, they consistently find positive relationships that persist for days or weeks.
This persistence stems from how information flows through markets. Major news events don't resolve instantly. A central bank policy announcement creates immediate market reaction, but the full implications unfold over subsequent sessions as analysts refine their interpretations, positioning adjusts, and related markets respond. Each stage generates new price discovery and sustained volatility.
Market microstructure amplifies this effect. During high volatility periods, bid-ask spreads widen as market makers protect themselves from adverse selection. Wider spreads increase trading costs, which paradoxically can increase volatility further as participants rush to complete transactions before costs rise even more. This feedback loop sustains elevated volatility beyond the initial trigger event.
Behavioral factors contribute significantly. Uncertainty breeds uncertainty—when markets move sharply, participants question their existing positions and analysis. This doubt increases trading activity as positions get adjusted, stops get triggered, and risk gets reassessed. The resulting order flow maintains elevated volatility even after the original news catalyst has been fully digested.
Measuring volatility persistence requires examining the decay rate of volatility shocks. A volatility spike that decays 50% within two days shows less persistence than one that decays 50% over two weeks. Most liquid financial markets exhibit half-lives of several days to weeks, meaning a volatility shock retains measurable influence well beyond its initial occurrence.
The persistence mechanism also operates in reverse. During calm periods, market participants grow comfortable with existing positions. Trading volumes decline, spreads tighten, and the market requires increasingly significant news to generate substantial price movement. This creates the "low volatility begets low volatility" dynamic that extends quiet periods beyond what random chance would suggest.
Volatility Clustering in Forex Markets
Currency markets exhibit particularly pronounced volatility clustering due to their unique structure and drivers. Unlike equity markets with daily opening and closing bells, forex operates continuously across global sessions, allowing volatility regimes to develop and persist without the reset that overnight closures provide.
High volatility periods in forex typically coincide with monetary policy decisions, geopolitical tensions, or significant economic data releases. The 2022 sterling crisis following the UK's mini-budget announcement created weeks of elevated GBP volatility. The Swiss National Bank's 2015 removal of the EUR/CHF floor generated extreme volatility that persisted as markets repriced Swiss franc exposure across countless positions.
The 24-hour nature of forex means volatility can build progressively across sessions. A Reserve Bank of Australia announcement during Asian hours might create initial AUD volatility that amplifies during European hours as more participants react, then potentially intensifies further during US hours if American economic data adds to the narrative. This cross-session transmission mechanism extends volatility clusters in ways that single-session markets don't experience.
Common Triggers of Volatility Regime Changes
Regime changes—shifts from low to high volatility or vice versa—rarely occur randomly. Central bank policy pivots represent the most reliable trigger. When the Federal Reserve signals a change in its policy stance, not just USD pairs but entire currency market volatility regimes shift as participants reassess interest rate differentials, carry trade viability, and risk appetite.
Political uncertainty creates sustained volatility clusters. Election cycles, coalition negotiations, or geopolitical conflicts introduce policy uncertainty that keeps currency markets volatile until resolution or adaptation occurs. The Brexit referendum's aftermath generated elevated GBP volatility that persisted for years, not weeks.
Liquidity events also trigger regime changes. Year-end position squaring, quarter-end rebalancing, or holiday-thinned markets can shift volatility regimes as reduced market depth amplifies price movements. These liquidity-driven clusters often show different characteristics than news-driven clusters—shorter duration but potentially more extreme intraday swings.
Cross-market contagion extends volatility clusters. Stress in equity markets frequently spills into forex through risk-on/risk-off dynamics. When equity volatility spikes, safe-haven currencies like JPY and CHF often experience their own volatility increases, creating correlated clustering across asset classes.
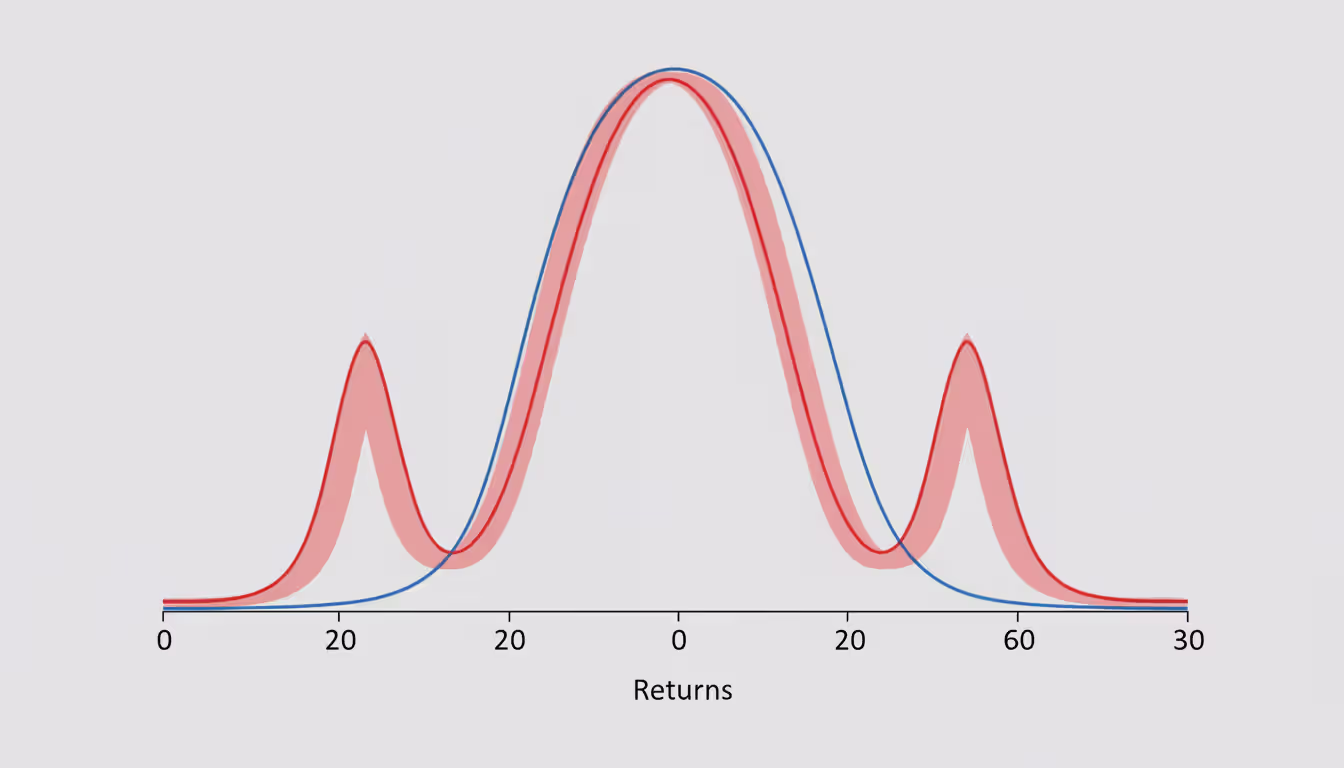
Fat Tails and Extreme Price Movements
Author: Vanessa Cole;
Source: martinskikulis.com
Volatility clustering directly contributes to the "fat tails" observed in return distributions—the higher-than-expected frequency of extreme price movements. Standard statistical models assuming constant volatility underestimate the probability of large moves because they fail to account for volatility's tendency to cluster.
During high volatility regimes, the probability of extreme moves increases substantially. A currency pair that normally sees 100-pip daily ranges might experience 300-pip moves during a volatility cluster. These extreme movements occur far more frequently than normal distribution models predict, creating the fat-tailed distributions that characterize real market returns.
This relationship creates compounding risk. Not only do extreme moves happen more often than simple models suggest, but they tend to happen in bunches. A trader experiencing one extreme adverse move faces elevated probability of additional extreme moves in subsequent sessions—precisely when their risk capacity may be most impaired.
The practical implication: risk models built on constant volatility assumptions systematically underestimate tail risk. A Value-at-Risk calculation assuming stable volatility might suggest a 1% daily loss occurs once per 100 days. In reality, volatility clustering means these losses cluster together—perhaps four times in a two-week volatile period, then none for six months.
The GARCH Model and Measuring Volatility Persistence
The Generalized Autoregressive Conditional Heteroskedasticity (GARCH) model, developed by Robert Engle and Tim Bollerslev, provides the standard framework for modeling volatility clustering. Unlike models assuming constant volatility, GARCH explicitly captures the tendency for volatility to persist over time.
The basic GARCH(1,1) model—the most commonly used specification—expresses today's volatility as a function of three components: a long-run average volatility level, yesterday's volatility, and yesterday's squared return (shock). The model parameters reveal how strongly volatility clusters and how quickly shocks dissipate.
The persistence parameter, calculated by summing the coefficients on lagged volatility and lagged shocks, indicates how long volatility clusters last. A persistence parameter of 0.95 suggests volatility shocks decay slowly, with 95% of a shock's impact remaining after one period. Values above 0.90 indicate strong clustering, while values below 0.80 suggest relatively rapid mean reversion.
For major currency pairs, GARCH estimates typically show persistence parameters between 0.90 and 0.98, confirming the strong volatility clustering observed empirically. EUR/USD, for instance, consistently exhibits persistence above 0.95, meaning a volatility shock retains substantial influence for weeks.
The model also enables volatility forecasting. Given current volatility and recent returns, GARCH projects future volatility by accounting for persistence. These forecasts outperform simple historical volatility estimates precisely because they incorporate clustering dynamics—recognizing that current high volatility predicts elevated future volatility.
Measuring volatility persistence through GARCH provides actionable intelligence. A trader observing a volatility spike can estimate how long elevated volatility will likely persist, informing decisions about position sizing, stop placement, and strategy selection. A persistence parameter of 0.96 suggests a volatility regime might last weeks; a parameter of 0.85 suggests days.
Extensions of the basic GARCH model capture additional features. EGARCH models allow volatility to respond asymmetrically to positive versus negative returns. GJR-GARCH models explicitly incorporate leverage effects. These refinements improve forecasting accuracy but the core insight remains: volatility exhibits strong, measurable, and exploitable persistence.
Implications for Traders and Risk Managers
Volatility clustering is one of the most robust empirical facts about financial markets. The GARCH model's success in capturing this phenomenon demonstrates that volatility is not just random noise, but contains predictable structure that has profound implications for risk management and derivative pricing
— Robert F. Engle
Volatility clustering fundamentally changes how market participants should approach position sizing. The traditional approach—maintaining constant position sizes based on long-run average volatility—ignores regime dynamics and overexposes capital during high volatility clusters while underutilizing it during calm periods.
Adaptive position sizing accounts for current volatility regime. During identified high volatility clusters, reduce position sizes to maintain consistent risk exposure. If your typical position risks $1,000 at 50-pip stop distance during normal volatility, and current volatility suggests 100-pip moves are now typical, halve your position size to maintain equivalent risk.
This adjustment isn't market timing—you're not predicting direction. You're recognizing that the distribution of possible outcomes has widened, requiring position size reduction to maintain consistent risk exposure. The clustering property means this adjustment should persist for multiple days or weeks, not just single sessions.
Stop-loss placement requires similar adaptation. During high volatility clusters, maintaining your normal stop distances will likely result in increased stop-outs from noise, even if your directional bias proves correct. Wider stops or smaller positions (or both) become necessary to avoid being shaken out of otherwise sound positions.
Strategy selection should respond to volatility regimes. Mean-reversion strategies that profit from overextended moves perform better during low volatility clusters when prices oscillate around equilibrium. Momentum strategies that capture sustained directional moves often work better during high volatility regimes when trends develop more decisively.
Risk managers must incorporate clustering into Value-at-Risk and stress testing frameworks. Models assuming independent, identically distributed returns will underestimate the probability of consecutive large losses. Realistic risk assessment requires recognizing that extreme loss days cluster together, creating sequences of drawdown that exceed simple probability calculations.
The forecasting challenge lies in identifying regime changes early. By the time a volatility cluster is obvious, much of its impact has occurred. Leading indicators—option implied volatility, bid-ask spreads, trading volume patterns—can provide earlier signals that a regime shift is developing, enabling proactive rather than reactive adjustment.
Characteristic
Volatility Clustering
Random Volatility
Predictability
Current volatility predicts near-term volatility
Past volatility provides no information about future volatility
Risk management approach
Dynamic position sizing and adaptive stops based on regime
Static position sizing and fixed stop distances
Model requirements
GARCH or similar models capturing persistence
Simple historical volatility or constant volatility assumptions
Typical duration
Regimes persist for days to weeks
Volatility level changes randomly each period
Market conditions
Reflects information flow and behavioral dynamics
Assumes constant market structure and participant behavior
Frequently Asked Questions About Volatility Clustering
What causes volatility clustering in financial markets?
Volatility clustering results from the way information flows through markets and how participants respond. Major news events don't resolve instantly—their implications unfold over days or weeks, generating sustained volatility. Behavioral factors amplify this: uncertainty triggers position adjustments, which generate order flow that maintains elevated volatility. Market microstructure effects like widening spreads during volatile periods create feedback loops that extend clusters beyond the initial trigger. The combination of gradual information processing, behavioral responses, and structural market features produces the persistent clustering observed across all liquid markets.
How long do volatility clusters typically last?
Duration varies by market and trigger, but most volatility clusters in major forex pairs persist for one to three weeks. GARCH model parameters suggest half-lives of several days, meaning a volatility shock retains measurable influence for 5-15 trading days. Clusters triggered by discrete events (like a single data release) tend to be shorter, while those driven by ongoing uncertainty (political crises, policy uncertainty) can extend for months. The key insight is that clusters last substantially longer than single sessions—once volatility elevates, it typically remains elevated through multiple trading days rather than immediately reverting to normal levels.
Can you predict when volatility clustering will occur?
Predicting the exact onset of new volatility clusters remains difficult, but identifying conditions that increase clustering probability is possible. Scheduled high-impact events (central bank meetings, major economic releases) create predictable clustering risks. Option implied volatility and volatility derivatives like the VIX provide forward-looking market expectations about volatility regimes. Technical indicators like Average True Range and historical volatility patterns can signal when current calm periods are extended and vulnerable to disruption. While precise timing eludes prediction, recognizing high-probability clustering environments enables proactive risk management adjustments.
Is volatility clustering the same across all asset classes?
Volatility clustering appears in all liquid financial markets, but its strength and characteristics vary. Equity markets show pronounced clustering, particularly during market stress periods. Commodities exhibit clustering related to supply disruptions and seasonal factors. Fixed income markets display clustering around monetary policy events. Forex markets show particularly strong clustering due to continuous trading and policy-driven dynamics. Cryptocurrencies exhibit extreme clustering with very high persistence parameters. The universal presence of clustering across asset classes reflects fundamental features of information processing and behavioral responses, though specific parameters and triggers differ by market.
How does volatility clustering affect option pricing?
Volatility clustering creates several option pricing complications. Standard Black-Scholes models assume constant volatility, leading to systematic mispricing when volatility clusters. During high volatility regimes, options become more valuable than constant-volatility models suggest because elevated volatility persists, increasing the probability of large moves throughout the option's life. This explains why implied volatility (market prices) often exceeds recent realized volatility—markets price in persistence. Stochastic volatility models like Heston explicitly incorporate clustering dynamics, producing more accurate prices. For traders, clustering means option value depends heavily on current volatility regime, not just long-run averages.
What's the difference between volatility clustering and market trends?
Volatility clustering and price trends are distinct phenomena. Volatility clustering describes the magnitude of price changes clustering together, regardless of direction—large moves follow large moves, small follow small. Trends describe persistent directional price movement—upward or downward momentum. Markets can exhibit high volatility without trending (choppy, range-bound action with large swings) or trend smoothly with low volatility (steady directional movement with small daily ranges). Clustering is about the size of price changes persisting; trends are about the direction persisting. Both represent departures from random walk assumptions but capture different aspects of price behavior.
Volatility clustering stands as one of the most reliable and consequential patterns in financial markets. The tendency for large price changes to follow large changes, and calm periods to extend, creates both risks and opportunities that market participants cannot afford to ignore.
For traders, recognizing volatility regimes enables smarter position sizing, more appropriate stop placement, and better strategy selection. Reducing exposure during high volatility clusters protects capital during the periods when risk is genuinely elevated. Increasing exposure during calm regimes captures opportunity when risk is genuinely lower.
For risk managers, incorporating clustering into models transforms abstract statistical exercises into realistic assessments. Value-at-Risk calculations that account for persistence produce more accurate risk estimates. Stress tests that recognize the clustering of extreme events better prepare organizations for actual market conditions.
The GARCH framework and its extensions provide the mathematical tools to measure, model, and forecast volatility persistence. These aren't merely academic exercises—they translate directly into actionable intelligence about how long current volatility conditions will likely persist and how risk exposures should adjust accordingly.
Volatility clustering reflects fundamental market realities: information processing takes time, uncertainty breeds uncertainty, and market structure creates feedback loops. These features aren't anomalies to be arbitraged away but permanent characteristics of how markets function. Successful market participation requires not fighting these dynamics but adapting to them through regime-aware risk management and strategy implementation.
Unsystematic risk represents investment uncertainty tied to specific companies or assets rather than broad market forces. Unlike systematic risks affecting all securities, firm-specific risks can be substantially reduced through proper diversification across 20-30 uncorrelated positions
Markets don't just move—they accelerate, decelerate, and shift gears. Volatility risk is the danger that unexpected changes in price swing intensity will damage your positions. Unlike directional risk, it strikes when market pace changes, hurting options traders, currency speculators, and leveraged investors alike
Systematic risk affects entire markets simultaneously—no diversification can eliminate it. Through concrete examples from interest rate changes to geopolitical events, understand how market-wide forces impact portfolios and learn practical measurement and management strategies using beta and asset allocation
Settlement risk arises when one party in a financial transaction delivers cash or securities but the counterparty fails before reciprocating. This guide explains how settlement risk occurs in forex markets, the 1974 Herstatt collapse, and modern mitigation tools like CLS Bank and payment-versus-payment systems
The content on this website is provided for general informational and educational purposes only. It is intended to explain concepts related to Forex (FX) trading, currency markets, leverage, hedging, and risk management.
All information on this website, including articles, guides, and examples, is presented for general educational purposes. Forex trading carries significant risk, and outcomes may vary depending on market conditions, leverage, and individual decisions.
This website does not provide financial, investment, or trading advice, and the information presented should not be used as a substitute for consultation with qualified financial professionals.
The website and its authors are not responsible for any errors or omissions, or for any outcomes resulting from decisions made based on the information provided on this website.