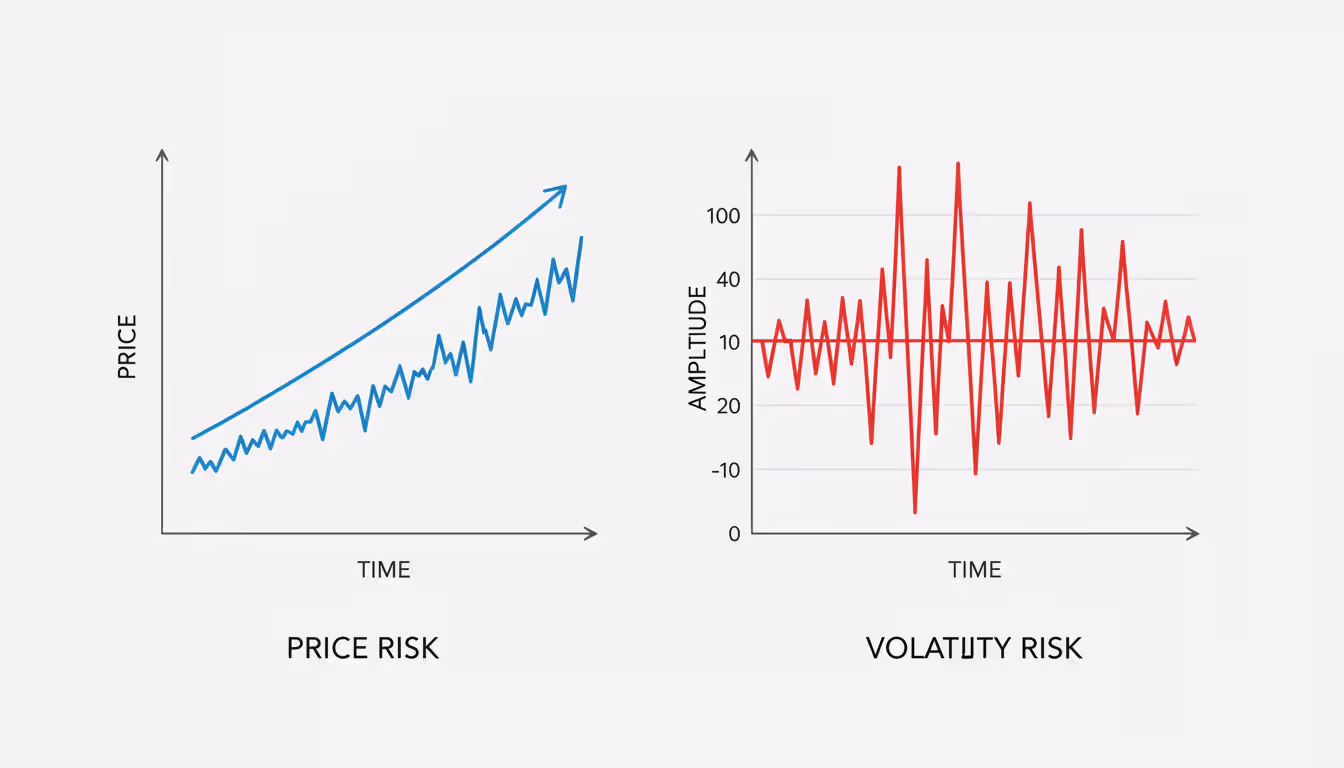
Markets move. Prices swing. Some days your portfolio gains 2%, other days it drops 3% before lunch. That uncertainty—the magnitude and frequency of price changes—is volatility. But volatility itself isn't risk. Volatility risk is the danger that unexpected changes in volatility will hurt your positions, strategies, or portfolio value in ways you didn't anticipate.
Unlike directional risk (where you lose money because the market moved against you), volatility risk strikes when the pace or intensity of price swings changes. A trader holding options might be right about direction but still lose money if implied volatility collapses. A currency pair might stay range-bound, yet wild intraday swings trigger stop-losses. Understanding and managing this dimension of risk separates consistent traders from those caught off-guard when markets shift gears.
Understanding Volatility Risk in Financial Markets
What is volatility risk, exactly? It's the exposure to losses caused by changes in the volatility of an underlying asset or market. Traditional market risk focuses on price direction—will the S&P 500 go up or down? Volatility risk asks a different question: will the S&P 500 become more erratic or calmer, and how will that change affect my positions?
This matters because many financial instruments have non-linear payoffs. Options are the clearest example: their value depends not just on the underlying price, but heavily on expected volatility. A call option buyer needs the stock to move; if volatility drops (meaning the market expects smaller price swings), that option loses value even if the stock price stays flat. The trader faces volatility risk.
Beyond options, volatility risk appears in:
Leveraged positions: Higher volatility increases the probability of margin calls or stop-outs, even if your ultimate directional view proves correct.
Dynamic hedging strategies: Many institutional hedges assume certain volatility levels. When volatility spikes or crashes, hedges become expensive or ineffective.
Risk parity portfolios: These allocate capital based on volatility. Sudden volatility changes force rebalancing at unfavorable prices.
The core challenge is that volatility itself is volatile. Markets can stay quiet for months, lulling traders into complacency, then explode in a week. The VIX—the most-watched equity volatility gauge—spent much of 2019-2020 below 15, then spiked above 80 in March 2020. Traders positioned for calm conditions faced catastrophic losses.
Author: Ethan Blackwell;
Source: martinskikulis.com
How Volatility Risk Affects Different Asset Classes
Volatility risk manifests differently depending on what you trade. Each asset class has unique volatility drivers, typical ranges, and trading implications.
Equities exhibit volatility clustering: calm periods alternate with turbulent ones. Individual stocks show higher volatility than broad indices due to idiosyncratic risks. Tech stocks typically swing more than utilities. Equity volatility tends to spike during market selloffs (the "volatility skew"), creating asymmetric risk for option sellers.
Volatility risk in currency trading deserves special attention because forex markets trade 24 hours and react instantly to global events. Major pairs like EUR/USD usually show annualized volatility around 8-12%, but emerging market currencies can exceed 20%. Central bank meetings, geopolitical tensions, and commodity price shocks drive sudden volatility changes. A currency trader might enter a position based on interest rate differentials, only to see a geopolitical tweet triple daily ranges overnight. Stop-losses that seemed prudent become inadequate; leverage that felt comfortable becomes dangerous.
Currency volatility also shows distinct patterns: it tends to spike during London-New York overlap hours and around major data releases. Traders ignoring these patterns face unexpected volatility exposure.
Commodities display volatility linked to supply disruptions, weather, and geopolitical events. Oil volatility can double within days following Middle East tensions. Agricultural commodities spike during growing-season weather scares. These aren't gradual changes—they're regime shifts that catch traders off-guard.
Fixed income instruments traditionally showed lower volatility, but that changed as central banks embarked on unconventional policies. Bond volatility spiked during the 2022 rate-hike cycle and remains elevated in 2026 as markets navigate uncertain monetary policy paths. Duration risk and volatility risk now interact in complex ways.
The table below compares volatility characteristics across major asset classes:
Asset Class
Typical Volatility Range (Annualized)
Primary Volatility Drivers
Common Measurement Tools
Typical Hedging Methods
Equities
15-25% (indices), 30-60% (individual stocks)
Earnings, economic data, sentiment shifts
VIX, historical volatility, beta
Put options, index futures, diversification
Forex
8-15% (majors), 15-30% (emerging markets)
Central bank policy, geopolitical events, trade flows
Currency volatility indices, ATR
Options, correlated pairs, position sizing
Commodities
20-40% (energy), 15-25% (metals)
Supply disruptions, weather, demand shocks
Futures implied volatility, rolling standard deviation
Futures spreads, options, physical hedging
Bonds
5-12% (government), 8-18% (corporate)
Interest rate changes, credit events, inflation
MOVE index, yield volatility
Duration matching, swaptions, Treasury futures
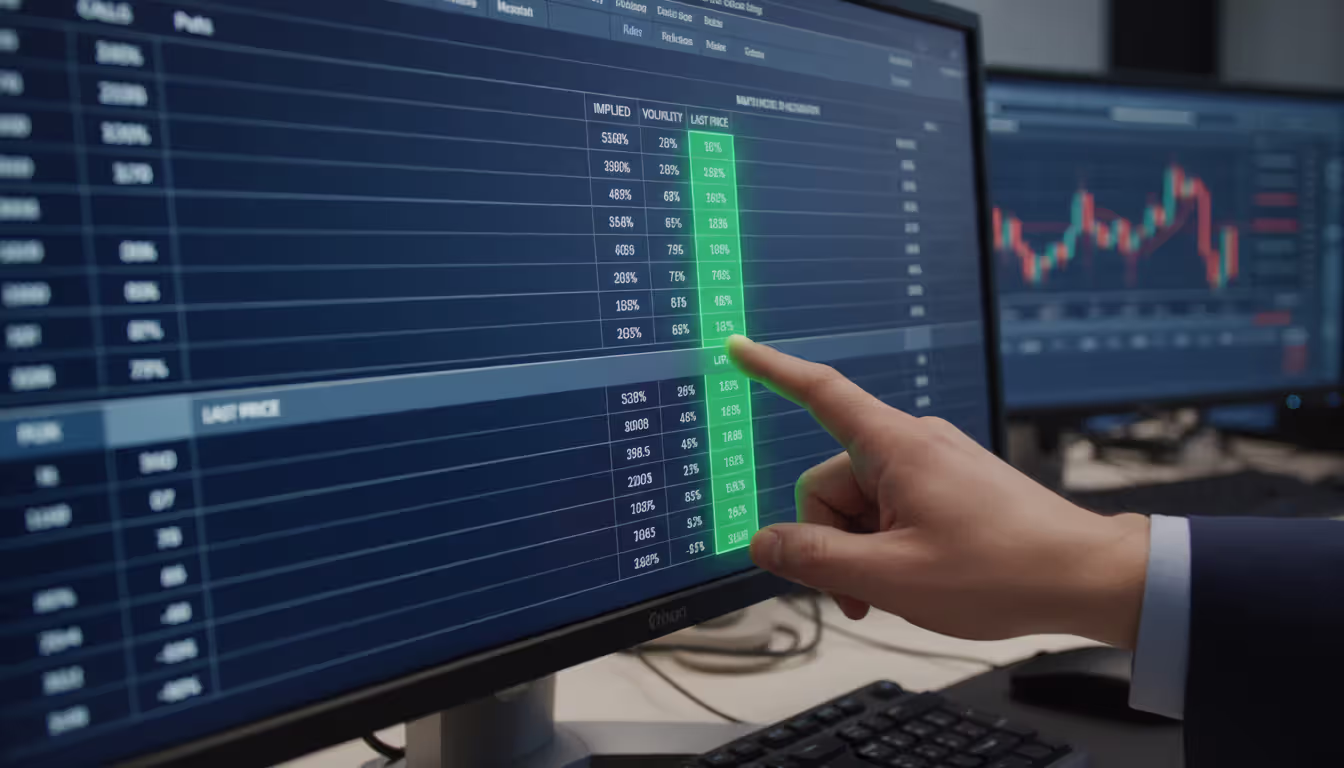
The Role of Implied Volatility in Option Pricing
Options pricing depends on several inputs: underlying price, strike price, time to expiration, interest rates, and critically, expected volatility. Implied volatility represents the market's consensus forecast of how much the underlying will move. It's extracted from actual option prices using models like Black-Scholes.
When implied volatility rises, option prices increase—both calls and puts. When it falls, options lose value. This creates a distinct risk profile for options traders that's independent of directional moves.
Author: Ethan Blackwell;
Source: martinskikulis.com
What Is Vega Risk in Options Trading
Vega measures an option's sensitivity to changes in implied volatility. If an option has a vega of 0.15, a one-percentage-point increase in implied volatility adds $0.15 to the option's price (per share, or $15 per contract).
Vega risk in options hits hardest in two scenarios:
After you buy options: You're long vega. If volatility drops (common after earnings announcements or when market fears subside), your options lose value even if the underlying moves in your favor. Traders buying weekly options before a Federal Reserve announcement face this risk—if the Fed delivers an expected decision, volatility often collapses immediately.
When you sell options: You're short vega. If volatility spikes, the options you sold become more expensive to buy back. Naked put sellers during calm markets have been crushed when volatility suddenly explodes, even if the underlying hasn't moved much yet.
Vega is highest for at-the-money options and increases with time to expiration. A six-month option has much higher vega than a one-week option. This means longer-dated options carry more volatility risk.
Understanding the Volatility Risk Premium
The volatility risk premium is a persistent market anomaly: implied volatility typically exceeds realized volatility. In other words, options tend to be "overpriced" relative to how much the underlying actually moves.
Why? Market participants pay a premium for protection and certainty. Investors willingly overpay for portfolio insurance (put options) because the cost is worth the peace of mind. This creates opportunities for sophisticated traders to systematically sell volatility and capture the premium.
However, harvesting the volatility risk premium isn't free money. It involves short volatility exposure, which means catastrophic losses during volatility spikes. Strategies that collected small profits for months can give it all back—and more—in a single volatility explosion. The cautionary tale: the VelocityShares XIV ETN, which tracked short VIX futures, lost 90% of its value in a single day (February 2018) during a volatility spike, eventually forcing liquidation.
The premium exists precisely because short volatility positions carry tail risk that most investors rationally avoid.
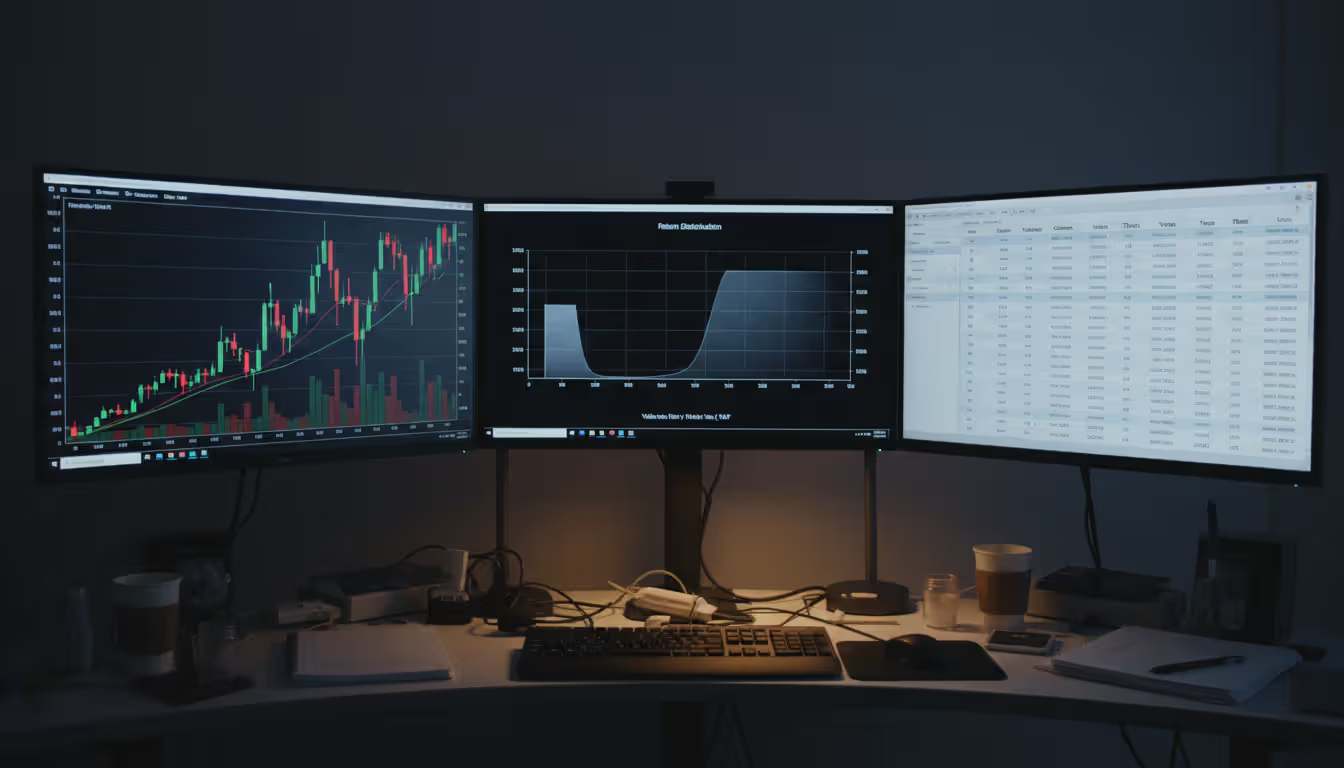
Measuring Volatility Risk in Your Portfolio
You can't manage what you don't measure. Volatility risk measurement requires both backward-looking and forward-looking metrics.
Historical volatility calculates actual price fluctuations over a past period, typically using standard deviation of returns. A stock with 30% annual historical volatility has seen its price fluctuate roughly 30% (one standard deviation) around its average return. Traders often calculate this over 20, 50, or 100-day windows. The limitation: past volatility doesn't guarantee future volatility.
Implied volatility reflects market expectations and is extracted from option prices. The VIX index, derived from S&P 500 option prices, is the most famous measure. VIX levels above 20 indicate elevated fear; below 12 suggests complacency. Other asset classes have similar indices: OVX for oil, GVZ for gold, EVZ for euro currency.
Beta measures how much an asset moves relative to a benchmark. A stock with beta of 1.5 tends to move 50% more than the market. High-beta portfolios face greater volatility risk during market swings.
Value at Risk (VaR) estimates potential losses at a given confidence level. A daily 95% VaR of $50,000 means there's a 5% chance of losing more than $50,000 tomorrow. VaR incorporates volatility assumptions, so it increases during high-volatility periods.
Position-level Greeks: For options portfolios, monitoring aggregate vega exposure reveals volatility risk. A portfolio with net positive vega benefits from volatility increases; negative vega means volatility spikes hurt you.
Smart traders monitor these metrics daily and adjust when volatility risk exceeds their tolerance. A position sized appropriately at 15% volatility might be dangerously large at 40% volatility.
Author: Ethan Blackwell;
Source: martinskikulis.com
Common Causes of Volatility Spikes
Volatility doesn't rise smoothly—it spikes suddenly in response to specific triggers. Recognizing these catalysts helps traders anticipate and prepare.
Economic data surprises: When inflation, employment, or GDP numbers deviate significantly from consensus, volatility jumps. The market reprices growth and policy expectations rapidly. The surprise inflation readings in early 2025 that forced the Fed to reverse course created multi-day volatility spikes across all asset classes.
Geopolitical shocks: Wars, political instability, and trade disputes inject uncertainty. Russia's energy supply disruptions in 2022-2023 created sustained commodity volatility. Middle East tensions in 2025 spiked oil volatility above 50%.
Central bank policy shifts: Unexpected rate changes or policy pivots trigger volatility. Markets hate uncertainty; when the Fed signals a new direction, volatility spikes until the new regime becomes clear.
Earnings announcements: Individual stock volatility often doubles around earnings. Implied volatility rises beforehand (traders buy options for protection or speculation) then collapses immediately after results, regardless of direction. This "volatility crush" is predictable but still catches inexperienced traders.
Liquidity crises: When market makers pull back or margin calls force liquidations, volatility explodes. The March 2020 COVID panic and the September 2019 repo crisis both saw volatility spike due to liquidity, not just fundamental news.
Technical triggers: Stop-loss cascades and algorithmic trading can amplify moves. When many traders have stops at similar levels, hitting those stops triggers more selling, accelerating the move and spiking volatility.
The common thread: uncertainty and forced repositioning. Volatility spikes when traders must act quickly with incomplete information.
Author: Ethan Blackwell;
Source: martinskikulis.com
Strategies for Managing and Hedging Volatility Exposure
Managing volatility exposure requires a toolkit of techniques, applied based on your portfolio, risk tolerance, and market conditions.
Position sizing: The simplest approach. When volatility doubles, cut position sizes in half to maintain consistent risk. Many traders use the formula: Position Size = Risk Capital / (Price × Volatility). This automatically scales down exposure as volatility rises.
Options strategies: - Protective puts provide downside insurance, though they cost money and suffer from volatility crush. - Collars (buying puts, selling calls) offer cheaper protection by funding puts with call premium. - Spreads limit both risk and reward, reducing volatility exposure compared to naked options. - Calendar spreads can profit from volatility changes between different expiration dates.
Diversification across volatility regimes: Combine assets with different volatility characteristics. Treasuries typically show negative correlation to equity volatility—when stocks spike, bonds often calm down. Commodities, currencies, and fixed income respond to different volatility drivers.
Volatility ETFs and ETNs: Products like VXX (long VIX futures) or SVXY (short VIX futures) allow direct volatility exposure. These are complex instruments with significant decay and roll costs—suitable for short-term tactical hedges, not long-term holdings. Many retail traders have lost money misunderstanding how these products work.
Dynamic hedging: Adjust hedge ratios as volatility changes. When volatility is low, hedges are cheap; when it spikes, you might reduce hedges (they're expensive) and rely on smaller positions instead.
Stop-losses and circuit breakers: Pre-defined exit rules limit losses during volatility spikes. Place stops based on volatility measures (like 2× Average True Range) rather than arbitrary percentages, so they adapt to current conditions.
Reduce leverage: High leverage amplifies volatility risk. A 10:1 leveraged position can be wiped out by a 10% adverse move; at 2:1 leverage, you survive a 50% drawdown. During elevated volatility, professionals reduce leverage proportionally.
The problem with volatility is that it is not the volatility itself that matters, but rather the unexpected change in volatility. You can survive high volatility if you expect it; you cannot survive a sudden spike if you're positioned for calm
— Nassim Taleb
The best approach combines several techniques. A currency trader might use smaller position sizes during central bank meetings, add protective options around major data releases, and maintain diversification across uncorrelated pairs.
Frequently Asked Questions About Volatility Risk
What is the difference between volatility and volatility risk?
Volatility is simply the statistical measure of price fluctuations—how much an asset's price moves up and down. Volatility risk is the potential for financial loss caused by unexpected changes in that volatility. You might accurately predict price direction but still lose money if volatility changes in ways that hurt your position structure, particularly with options, leveraged trades, or complex strategies.
How does volatility risk differ in stocks versus currencies?
Stock volatility tends to be asymmetric—it spikes more during selloffs than rallies, creating the "volatility skew." Individual stocks show higher volatility than indices. Currency volatility is more symmetric but responds instantly to global events 24/7. Currency pairs also show distinct intraday patterns, with volatility clustering around economic releases and trading session overlaps. Emerging market currencies exhibit much higher baseline volatility than major pairs, while blue-chip stocks might be calmer than exotic currencies.
Can you profit from volatility risk?
Yes, by taking the opposite side—accepting volatility risk in exchange for premium. Selling options systematically captures the volatility risk premium, earning income from overpriced implied volatility. This works during normal markets but can produce catastrophic losses during volatility spikes. Alternatively, traders can buy volatility when it's cheap (VIX below 12) and sell when it spikes (VIX above 30), though timing is difficult. Volatility arbitrage strategies exploit mispricings between implied and realized volatility, but require sophisticated execution.
What is a good volatility level for options trading?
"Good" depends on your strategy. Options buyers prefer low implied volatility (cheap options that might appreciate when volatility rises). The VIX below 15 offers attractive entry points for long options. Options sellers prefer high implied volatility (expensive premium to collect), but must manage the risk of further spikes. VIX above 25 offers attractive premium but elevated risk. Most importantly, compare current implied volatility to historical ranges for that specific asset—a "high" VIX of 20 might be low for an individual tech stock that normally trades at 50% implied volatility.
How do professionals hedge against volatility risk?
Institutional traders use several approaches: maintaining balanced books (offsetting long and short vega positions), dynamically adjusting hedges as volatility changes, diversifying across assets with different volatility profiles, and using variance swaps or VIX futures for pure volatility exposure. They also stress-test portfolios under various volatility scenarios and set strict vega limits. Many employ gamma scalping—continuously rebalancing delta hedges to profit from realized volatility while managing vega exposure.
Is high volatility always bad for investors?
No. High volatility creates opportunities as well as risks. Active traders can profit from larger price swings through directional trades or mean-reversion strategies. Options sellers collect higher premiums during elevated volatility. Long-term investors can buy quality assets at discounted prices during volatility-driven selloffs. However, high volatility increases the risk of permanent capital loss, forces wider stop-losses, and can trigger emotional decision-making. The key is matching your strategy to the volatility environment rather than fighting it.
Volatility risk represents a distinct dimension of market exposure that affects every trader and investor, whether they recognize it or not. Unlike simple directional risk, where you lose money because the market moved against you, volatility risk strikes when the intensity or pace of price movements changes unexpectedly. Options traders face it through vega exposure, currency traders encounter it during geopolitical shocks, and equity investors feel it when market regimes shift from calm to chaotic.
The measurement tools—historical volatility, implied volatility indices like the VIX, position Greeks, and value-at-risk metrics—provide visibility into your exposure. Common triggers include economic surprises, central bank policy shifts, geopolitical events, and liquidity crises. Recognizing these catalysts helps you anticipate periods of elevated risk.
Managing volatility exposure requires a multi-layered approach: appropriate position sizing that scales with volatility, strategic use of options for hedging or income, diversification across assets with different volatility characteristics, and discipline to reduce leverage when markets become erratic. The volatility risk premium offers profit opportunities for those willing to sell volatility systematically, but this strategy demands rigorous risk management to survive inevitable spikes.
Successful trading in 2026's dynamic markets means respecting volatility risk as a primary consideration, not an afterthought. Build it into your position sizing, monitor it daily, and adjust your approach as market conditions evolve. The traders who thrive aren't those who avoid volatility entirely—that's impossible—but those who understand, measure, and manage their exposure with clear-eyed discipline.
Unsystematic risk represents investment uncertainty tied to specific companies or assets rather than broad market forces. Unlike systematic risks affecting all securities, firm-specific risks can be substantially reduced through proper diversification across 20-30 uncorrelated positions
Volatility clustering describes how large price changes tend to follow large changes, and calm periods extend—one of the most consistent patterns in financial markets. Understanding this phenomenon transforms risk management and trading strategy across forex, equities, and other assets
Systematic risk affects entire markets simultaneously—no diversification can eliminate it. Through concrete examples from interest rate changes to geopolitical events, understand how market-wide forces impact portfolios and learn practical measurement and management strategies using beta and asset allocation
Settlement risk arises when one party in a financial transaction delivers cash or securities but the counterparty fails before reciprocating. This guide explains how settlement risk occurs in forex markets, the 1974 Herstatt collapse, and modern mitigation tools like CLS Bank and payment-versus-payment systems
The content on this website is provided for general informational and educational purposes only. It is intended to explain concepts related to Forex (FX) trading, currency markets, leverage, hedging, and risk management.
All information on this website, including articles, guides, and examples, is presented for general educational purposes. Forex trading carries significant risk, and outcomes may vary depending on market conditions, leverage, and individual decisions.
This website does not provide financial, investment, or trading advice, and the information presented should not be used as a substitute for consultation with qualified financial professionals.
The website and its authors are not responsible for any errors or omissions, or for any outcomes resulting from decisions made based on the information provided on this website.